


Figure 2. Th17 cells express lower levels of MIP-1α and MIP-1β.
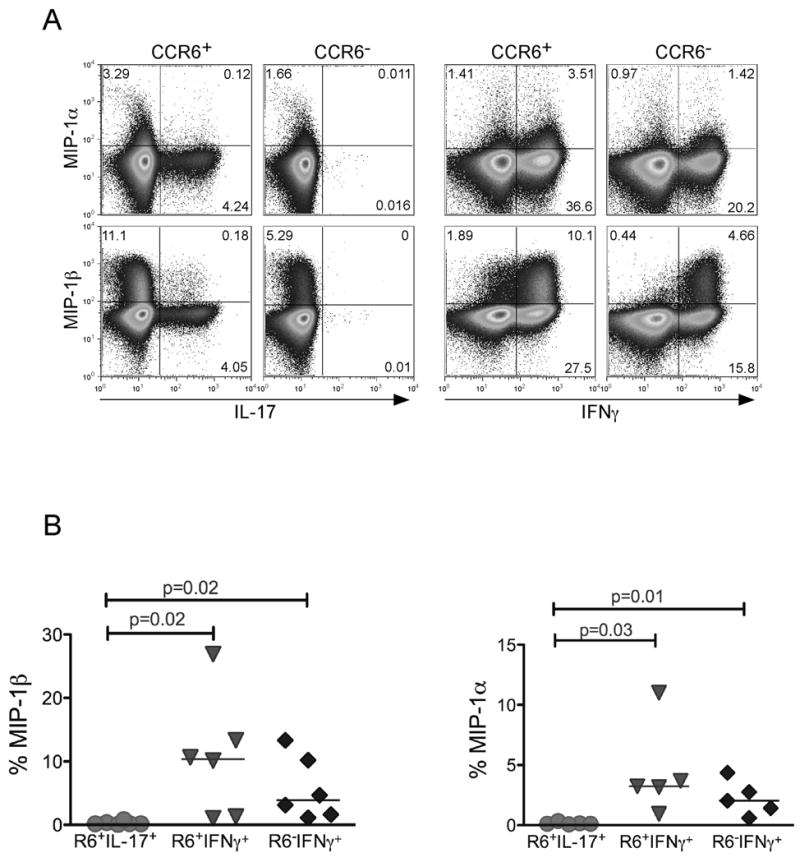
Resting CD4+ T cells from peripheral blood were further purified based on CD45RO and CCR6 markers into CD45RO+CCR6+ and CD45RO+CCR6−. Purified subsets were then stimulated with PMA and Ionomycin in the presence of Golgi Stop. (a) Cells were co-stained with anti-IL-17-FITC, IFNγ-pecy7, and either MIP-1α or MIP-1β-PE. (b) The percent MIP-1α and MIP-1β producing cells were determined in CCR6+IL-17+, CCR6+IFNγ+, and CCR6−IFNγ+ subsets in different healthy donors. P values were calculated using the Two-Sample Student’s t-test.