


Fig. 1.
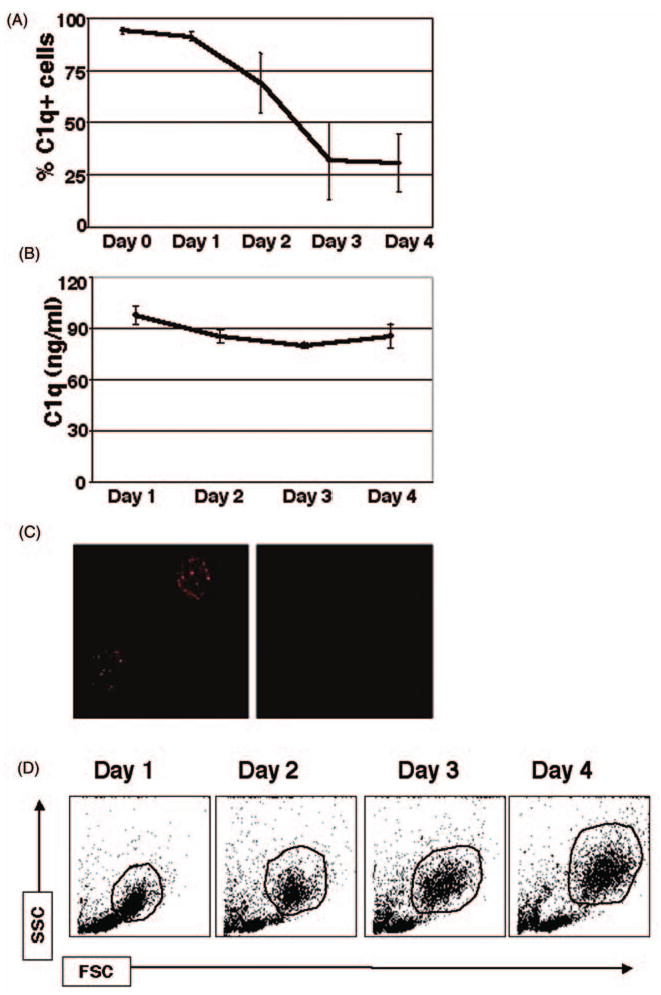
Kinetics of extracellular C1q expression during the monocyte-to-DC transition (surface [A,C], secreted [B]). Mononuclear cells (MNCs) isolated from PB and cultured in the presence of GM-CSF + IL-4 were analyzed for surface expression and secretion of C1q. (A) Cells were analyzed by flow cytometry for surface bound C1q on days 0–4. Cell surface expression of C1q was highest on days 0–2, and it was greatly reduced by day 4. Isotype-matched Ab was used as a negative control; cells were gated on the HLA-DR+ population. (n = 4) (B) Cell supernatants were assessed for secreted C1q by sandwich ELISA. C1q secretion remained at a steady level of 90 ± 3 ng/ml throughout days 1–4. (n = 4). (C) Detection of surface C1q on fresh PB monocytes by immunofluorescent microscopy. MNCs were isolated and immediately analyzed for surface bound C1q. Isotype-matched Ab was used as a negative control (n = 3). (D) Light scatter profile analysis of peripheral blood mononuclear cells on days 1–4 in culture in the presence of DC growth factors. One representative experiment is shown. The gated populations indicated (HLA-DR+) were used for subsequent analysis (n = 20). FSC, forward scatter; SSC, side scatter.