


Figure 5.
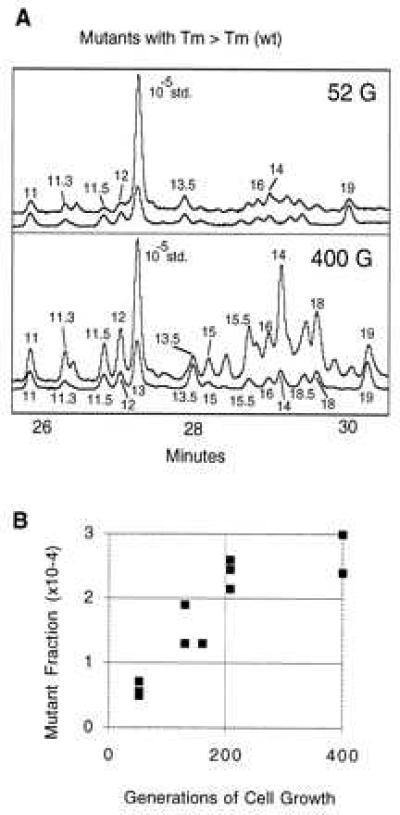
Mutational spectra of cultured human cells. (A) TK6 cells grown for 52 and 400 generations were sampled. DNA was isolated from an aliquot of cells and subjected to mutational spectrometry. CDCE runs of the mutational spectra observed are shown. The axes are as in Fig. 1. Only the mutants with melting temperatures higher than wild type are shown. (B) Increase in mutant fraction of mutant 1 (G → A, base pair 10,068) with generations of human cells grown in culture. TK6 cells were grown in spinner cultures and sampled at the number of generations designated on the horizontal axis. Mutant fraction is plotted on the y axis. Individual points represent separate mutant fraction determinations from independent cell aliquots taken from a single culture.