


Figure 1.
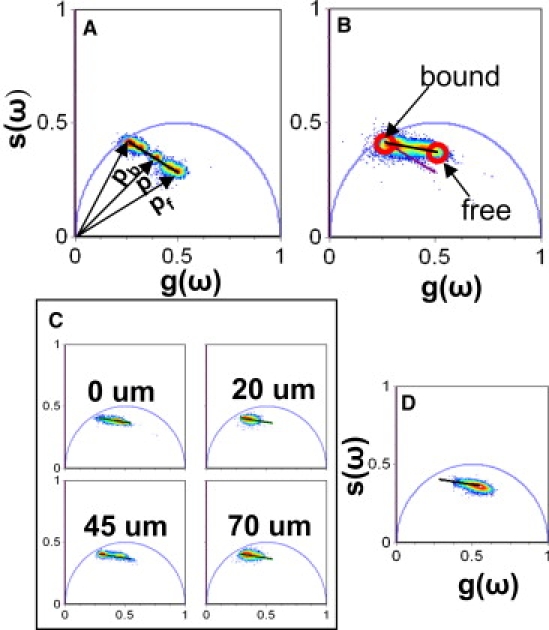
Calcium calibration in tissue. (A) Phasor representation of FLIM acquired from buffered solutions of known calcium concentrations. (B) CG5N phasor distribution from three different human skin samples. The calibration curve in the tissue (black line) and the comparison with the calibration curve in solution (purple line) are shown. (C) CG5N lifetime distribution at different depths of adult truncal skin. (D) CG5N lifetime distribution of adult truncal skin treated with 260 μM EGTA overnight. The same lifetime distribution is observed at all depths in the EGTA-treated samples. The broadness of the distribution is due to the fact that the EGTA does not homogeneously chelate the sample at all depths.