


Figure 7.
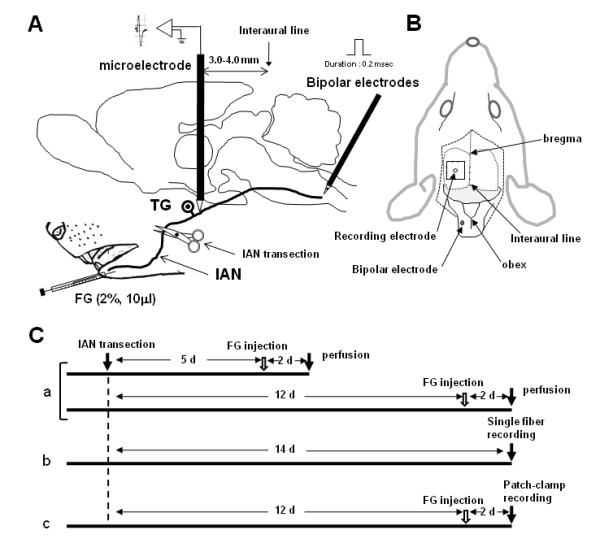
The experimental diagram and time-course of the present study. A: The schematic illustration of the FG injection site, electrode placement, B: Top view of the experimental set-up, C: The time-course of the present experiment. Ca: FG tracing experiment, Cb: single fiber recording experiment, Cc: patch-clamp recording experiment.