


Figure 5.
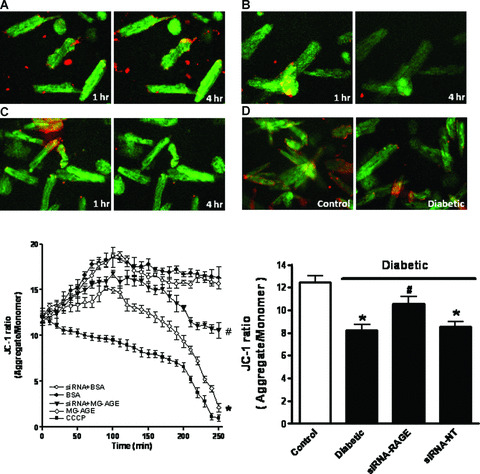
Cardiomyocyte mitochondrial membrane potential (MMP) from control cardiomyocytes incubated with BSA (A, 2.5 μmol/l), MG‐AGE (B, 2.5 μmol/l) or CCCP (C, 10 μmol/l) for 1 and 4 hrs as well as STZ‐induced diabetic myocytes (D, E) Kinetic changes of MMP in response to MG‐AGE or siRNA treatment using JC‐1 fluorochrome (ratio of red to green fluorescence); (F) MMP between control and diabetic mice with srRNA‐RAGE or siRNA‐NT treatment. Mean ± S.E.M., n= 4, *P < 0.05 versus BSA or control group, # P < 0.05 versus diabetic or MG‐AGE group.