


Figure 2.
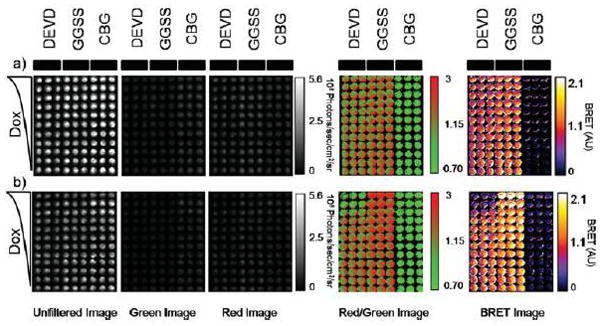
Utilization of single-chain protease BRET biosensor to report on doxorubicin-induced caspase activation. a, b) HeLa cells were transiently transfected with either pCBG-DEVD-tdTomato, pCBG-GGSS-tdTomato, or pCBG alone and then plated into triplicate columns in two black-walled 96-well plates. After 24 hours, decreasing concentrations of doxorubicin, 10 μM to 0 from the top of the plate to the bottom of the plate, were added to the cells and then imaged at 5 time points in an IVIS100. The times displayed are 1.5 hr (a) or 12 hr (b) (peak induction). The displayed images are, from left to right, the average radiance acquired from an unfiltered acquisition, a green filter (540AF20 nm), or a red filter (>590 nm long pass). After thresholding out the detector noise, the ratio of the red filtered image to the green filtered image was calculated and false colored. Finally, a BRET image was calculated by subtracting from each pixel in the red/green ratio imagine the average value of the red/green ratio from CBG wells that were not treated with doxorubicin. Note that images were cropped to remove blank wells to improve clarity and presentation of the figure panel.