


Fig. 6.
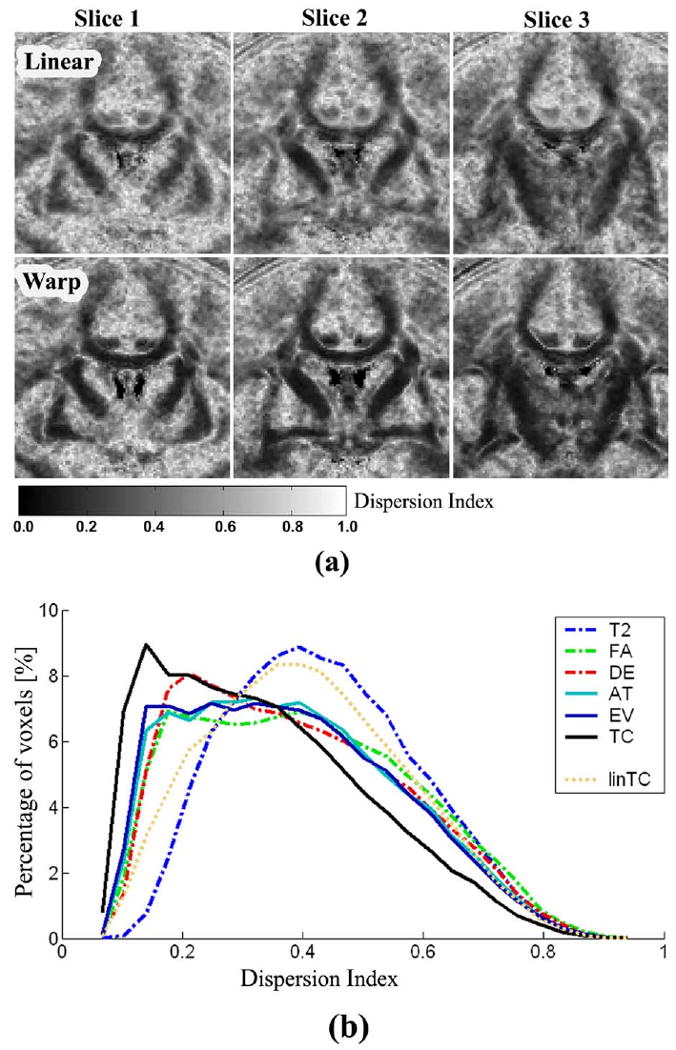
Maps and histograms of dispersion index for linear registration and nonlinear registration. Dispersion maps at three different coronal slices derived from linear registration (Linear) using TC are displayed in the upper row of (a) and those of nonlinear registration (Warp) using TC are displayed in the lower row of (a). Gray level color shows the dispersion index. Black indicates the lowest dispersion meaning complete coherence of the direction of tensors of the group, whereas white indicates the high dispersion indicating random distribution of tensor directions. Dispersion index maps of nonlinear registration shows more dark black areas than linear registration, indicating better performance of nonlinear registration in the alignment of principal direction of tensors. The dispersion index histogram (b) of nonlinear registration using TC (black line) shows shifted toward zero compared with nonlinear registration using T2 (blue dash-dot line), FA (green dash-dot line), DE (red dash-dot line), AT (cyan line), EV (blue line), and linear registration using TC (linTC, ochre dotted line). This closeness to zero implies the better performance of registration. This histogram was calculated inside the white matter.