


Figure 3.
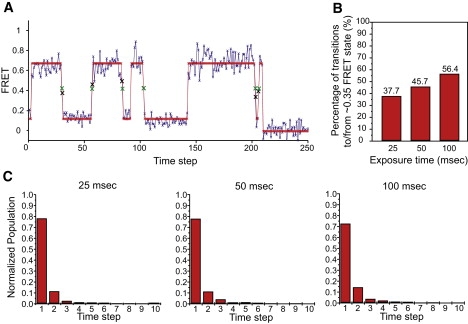
Analysis of the smFRETL1–tRNAfmid state. (A) A representative smFRETL1–tRNA trace idealized by ME, taken from the 50-ms exposure time data set. Both the observed data (blue) and idealized path (red) are shown. Individual data points, real and idealized, are shown as Xs. To emphasize the data at or near fmid, the Xs are enlarged and the observed and idealized data are shown in black and green, respectively. (B) Bar graph of the percentages of transitions to or from the fmid state under 25 ms, 50 ms, and 100 ms CCD integration time. (C) Normalized population histograms of dwell time spent at the fmid state under 25 ms, 50 ms, and 100 ms CCD integration time.