


Figure 3. IgD binds to basophils and mast cells in vivo.
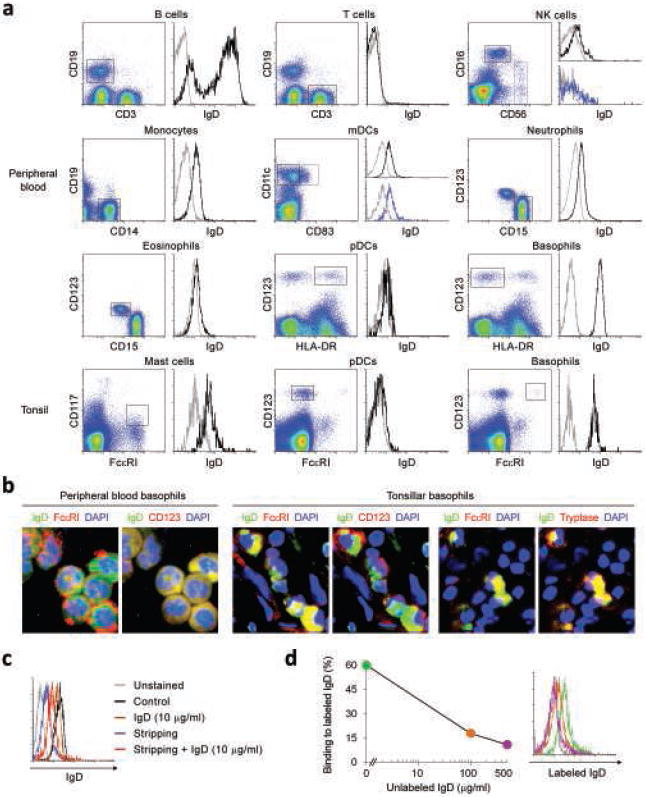
(a) Flow cytometric analysis of IgD on circulating or tonsillar CD19+CD3− B cells, CD19−CD3+ T cells, CD16highCD56low or CD16lowCD56high NK cells, CD19−CD14+ monocytes, CD11c+CD83− or CD11c+CD83+ myeloid dendritic cells (mDCs), CD15+CD123− neutrophils, CD15+CD123low eosinophils, CD123+HLA-DR+ or CD123+FcεRIlow plasmacytoid dendritic cells (pDCs), CD123+HLA-DR− or CD123+FcεRI+ basophils, and CD117+FcεRI+ mast cells. Gray and black histograms depict control unstained cells and IgD, respectively. A F(ab’)2 pAb was used to detect IgD. Dead cells were excluded using 7-AAD staining. (b) Immunofluoresence analysis of circulating and tonsillar basophils stained for IgD (green) and FcεRI, CD123 or tryptase (red). DAPI (blue) counterstains lobated nuclei of basophils. A F(ab’)2 pAb was used to detect IgD. (c) Flow cytometry of IgD levels on circulating basophils before (black histogram) and after exposure to exogenous monoclonal IgD (10 μg/ml, brown histogram), treatment with acidic buffer (blue histogram), and treatment with acidic buffer followed by addition of exogenous IgD (red histogram). A F(ab’)2 pAb was used to detect IgD. Unstained basophils were used as control (gray histogram) and dead cells were excluded using 7-AAD staining. (d) Binding of labeled monoclonal IgD to circulating basophils stripped of endogenous IgD and incubated with 0 μg/ml (green histogram), 100 μg/ml (orange histogram) or 500 μg/ml (purple histogram) of unlabelled monoclonal IgD. A F(ab’)2 pAb was used to detect IgD. Unstained basophils were used as control (gray histogram) and dead cells were excluded using 7-AAD staining. Panels a-d show 1 of 5 experiments yielding similar results.