


Figure 1.
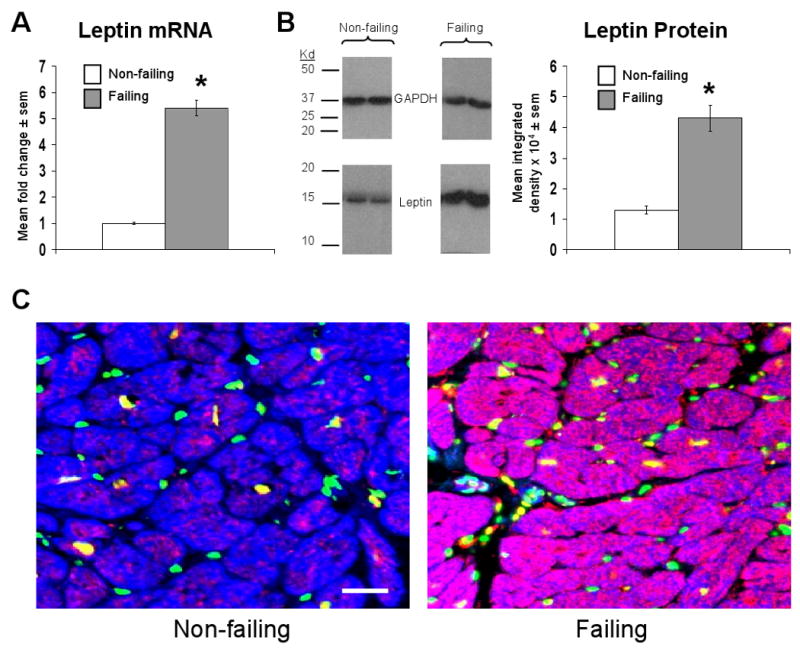
Failing human cardiac tissue demonstrates increased leptin mRNA and protein expression. A) Mean ± sem fold change in cardiac leptin mRNA in failing (n=10) relative to non-failing (n=6) samples, the latter of which were arbitrarily assigned a value of 1 after statistical calculations were performed. *p<0.05 relative to non-failing samples. B) Mean ± sem integrated density of leptin bands detected on x-ray film from failing (n=10) and non-failing (n=6) samples (right graph), with representative images and molecular weight markers shown. *p<0.05 relative to non-failing samples. C) Representative 20× power immunofluorescent staining of cardiac sections from a non-failing (left image) and failing (right image) human heart. Leptin staining is shown in red, nuclei (stained with DAPI) are shown in green, cells containing sarcomeric actin (stained with phalloidin) are shown in blue, and an accompanying scale bar (10μM) is shown in white.