


Figure 6.
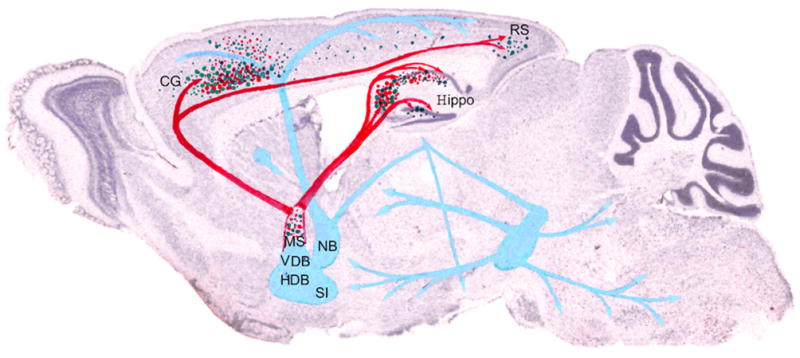
Schematic of VBT2 changes in Ts65Dn mice.
Decreases in T2 correlate with cholinergic deficits observed in Ts65Dn mice. Green dots show the distribution of VBT2 and red dots represent areas with a dramatic loss of the cholinergic phenotype. Red arrows indicate MSN cholinergic pathways and blue arrows indicate additional cholinergic pathways. Cholinergic deficits in Ts65Dn mice are located predominantly within the MSN as well as the projection path to the cingulate cortex and hippocampus, where VBT2 hypointensities also were prominent Key: CG, cingulate cortex; HDB, horizontal limb of the diagonal band; Hippo, hippocampus; NB, nucleus basalis; RS, retrosplenial cortex; SI, substantia innominata, VDB, ventral limb of the diagonal band.