


Figure 6.
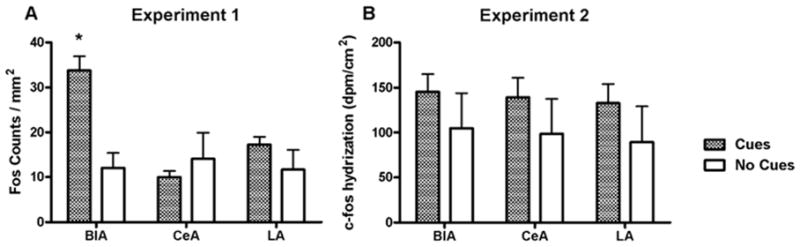
Fos protein (A) and c-fos mRNA (B) expression in amygdala of rats receiving response-contingent cue presentations (Cues group) and rats whose lever presses produced no consequences (No Cues group). In A, a * above the column pair for a region represents a post hoc significant difference (Newman-Keuls test, p < 0.05) in expression between Cues and No Cues groups for that region.