


Figure 2.
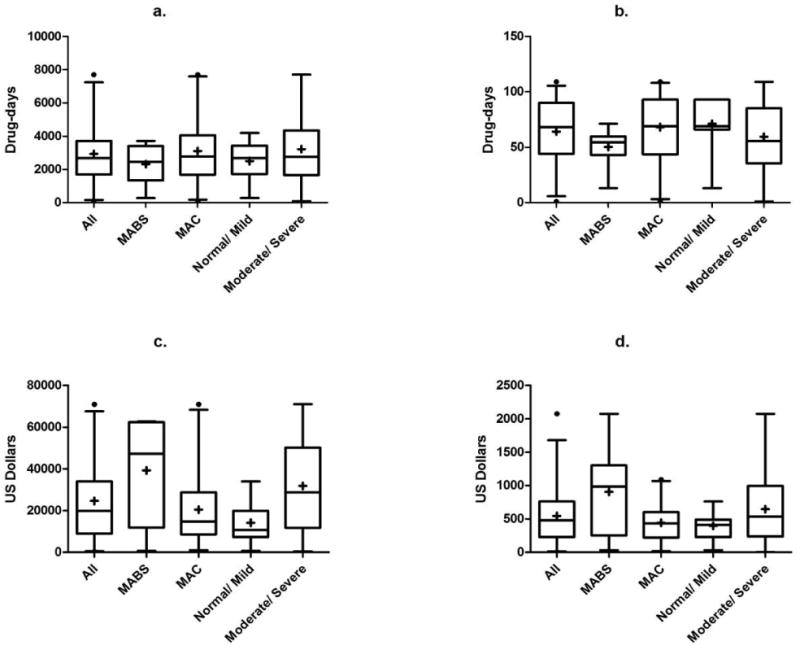
Burden of treatment and medication costs. Box and whisker plots where the plus signs and horizontal lines within the boxes represent the mean and median values, the top and bottom of boxes represent the 75th and 25th percentiles, the vertical lines represent the 95th and 5th percentiles, and the circles represent outliers. Data are categorized for all subjects, those with Mycobacterium abscessus (MABS), and those with Mycobacterium avium complex (MAC) and represent: a. Total burden of treatment per patient in drug-days (sum of the number of days on each drug); b. Monthly burden of treatment (total burden divided by the number of months of follow-up); c. Total medication costs per patient; d. Monthly medication costs per patient.