


Figure 3.
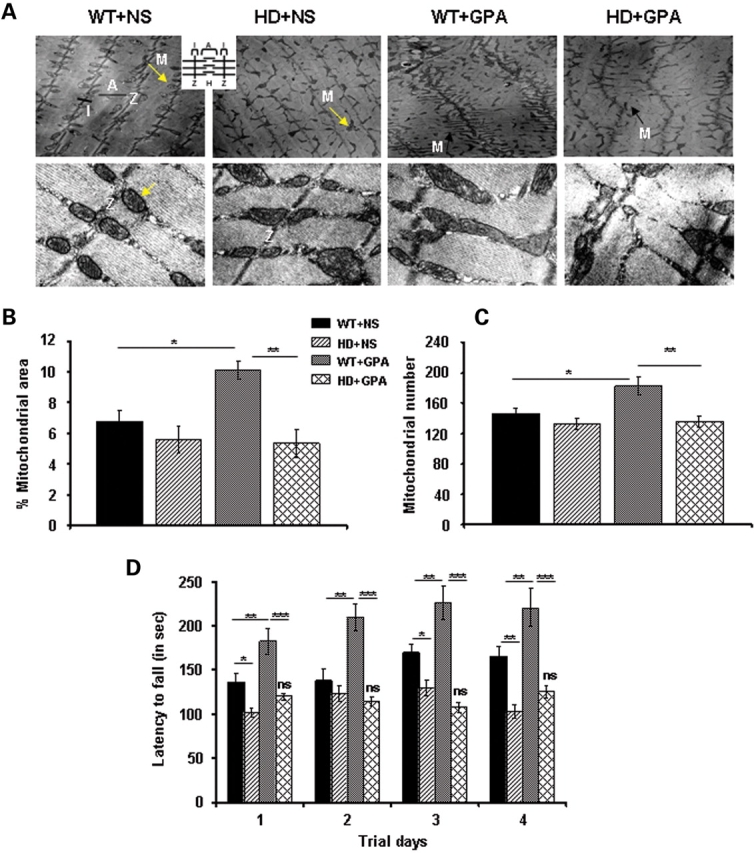
Decreased mitochondrial area/number and rotarod performance in NLS-N171-82Q HD mice under energy deprivation conditions. (A) Transmission electron microscopic analysis of soleus muscle from WT and HD mice treated with NS or GPA. Upper panel shows the mitochondria on lower magnification (4800×) and lower panel shows mitochondria on higher magnification (19 000×). Arrow indicates mitochondria along Z-axis. M, mitochondria; Z, Z-axis; I, I band; A, A band. Inset depicts schematic diagram of muscle fiber anatomy. An altered morphology and alignment of mitochondria along the Z-axis was observed in HD mice under basal conditions when compared with WT mice, where mitochondria are well organized (Fig. 3A, upper). GPA treatment in WT and HD mice caused an altered orientation of mitochondria along the Z-axis, and varying size of mitochondria, while an increase in numbers of mitochondria was observed only in WT mice (Fig. 3A, upper). Higher magnification depicts normal shape and size of mitochondria and the presence of well assembled cristae in mitochondria of soleus muscle of WT mice (Fig. 3A, lower). Mitochondria in GPA-treated and untreated HD mice are slightly larger in size with irregular assembly of cristae. GPA treatment also caused an enlargement of mitochondria in WT mice (Scale bars = 0.2 µm for upper panel and 2 µm for lower panel). (B and C) Corresponding quantification of percentage mitochondria area fraction and mitochondria number from the transmission electron microscopic images of soleus muscles from WT and HD mice. Data are expressed as mean ± SEM. *P < 0.05, **P < 0.01 (n = 8). (D) Rotarod performance was measured in GPA-treated WT and HD mice at the 10th week of GPA treatment. Mice were tested for latency to fall on accelerated rotarod in thrid consecutive trials per day for 4 days. Data are expressed as mean ± SEM. ns = non-significant versus HD + NS. *P < 0.05, **P < 0.01, ***P < 0.001 (n = 10 mice per group).