


Figure 6. Conjugation of Ub to drICE Acts as a “Mixed” Inhibitor.
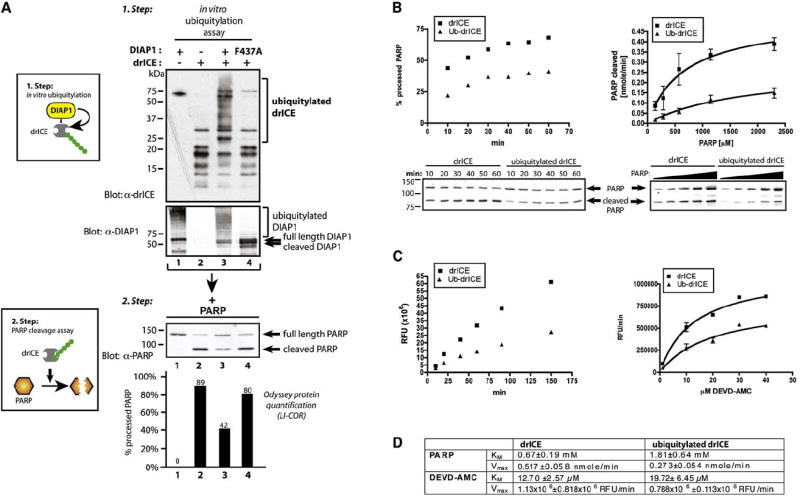
(A) In vitro ubiquitylation of recombinant drICE suppresses its catalytic ability to cleave PARP. Schematic representation of the assay procedure (left panels). In vitro ubiquitylation assay of active drICE with DIAP1 or DIAP1F437A. Arrows on the DIAP1 panel indicate DIAP1 cleavage. (Bottom panel) Step 2 depicting in vitro PARP cleavage assay: the ubiquitylation reactions from step 1 were incubated with recombinant PARP. Shown is immunoblot analysis with α-PARP antibodies. Graphs indicate LI-COR Odyssey quantification of the signal expressed as % of processed PARP in relation to total PARP (lower panel). Values and immunoblot analysis of a representative experiment are shown.
(B and C) Ubiquitylation changes kinetic parameters of active drICE. drICE was incubated in an in vitro ubiquitylation reaction with DIAP1 or DIAPF437A as in Figure 5D. (B) 10.3 nmole of PARP (left panel, a representative experiment is shown) or increasing concentrations of PARP (2.1–34.5 nmole, 15 min, right panel) was incubated with drICE or ubiquitylated drICE. PARP cleavage was monitored by immunoblot analysis. Western blot data were analyzed by LI-COR Odyssey quantification as in Figure 5D. Nonlinear regression using the Michaelis-Menten equation was applied to obtain a curve fit (right panel). (C) drICE was incubated in an in vitro ubiquitylation reaction with DIAP1 or DIAPF437A as in Figure 5D. drICE and ubiquitylated drICE were incubated with 20 μM DEVD-AMC, and DEVDase activity was analyzed at the indicated time points (left panel, shown is a representative experiment). (Right panel) Increasing substrate concentrations were used, and DEVDase activity was measured at 20 min. Curve fit was performed as in (B). RFU, relative fluorescence units.
(D) KM and Vmax (±SE) were determined from the curves shown in (B) and (C) using Prism software.