


Figure 3. Comparison of DNase-chip and MPSS data for CD4+ T cells.
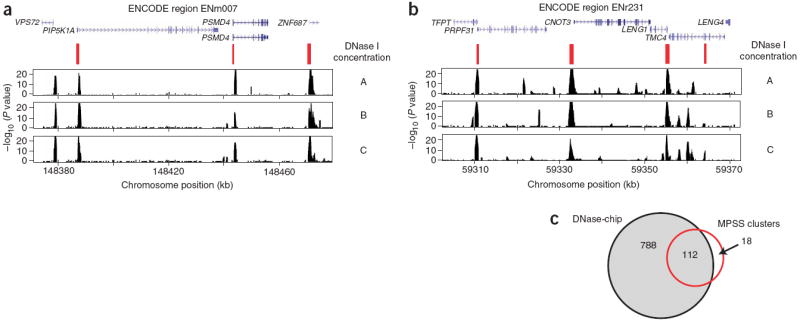
(a,b) DNase-chip P value data from two different ENCODE regions shows peaks that are detected using multiple concentrations of DNase I. MPSS clusters (in red) show DNase I hypersensitive sites that were previously identified using a sequence-based approach and clustering of tags. Note that there are regions detected by DNase-chip that have not been detected by MPSS, as expected because of limitations in the number of sequence tags. Many DNase-chip peaks that are only detected with a single DNase I concentration appear to be false positives. (c) Venn diagram shows the number of DNase I hypersensitive sites identified by DNase-chip (black; the number of DNase-chip regions are normalized using positive predictive values) and validated MPSS clusters (red).