


Figure 7.
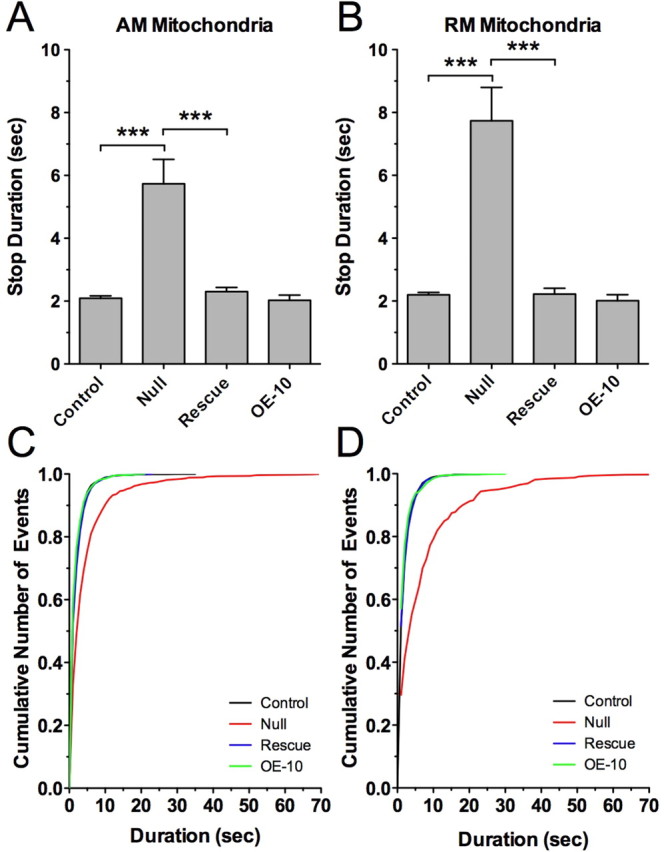
Loss of dMiro increases the duration of stop periods. A, B, Average duration of stops by AM (A) and RM mitochondria (B) in control, dmiro null mutant motor axons (Null), dmiro null mutants expressing normal dMiro protein (Rescue), and during overexpression (OE-10) of normal dMiro protein. Significant differences are indicated by asterisks (p < 0.001; N <18; one-way ANOVA). Error bars represent SEM. C, D, Cumulative frequency distribution for the duration of stops by AM (C) and RM mitochondria (D) of the indicated genotypes.