


FIGURE 4.
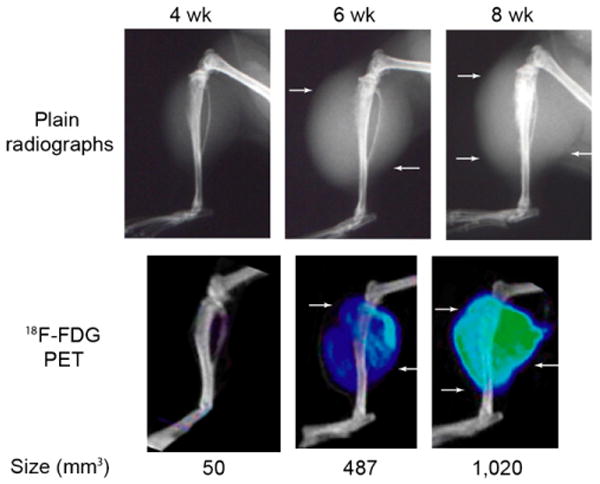
Plain radiographs and corresponding PET/CT images of a representative LAPC-9 tumor using 18F-FDG at 4-, 6-, and 8-wk time points. A progressive increase of 18F-FDG uptake on PET images is pervasive where soft-tissue shadows are visible on plain radiographs (arrows). LAPC-9 tumors at the 8-wk time point show the strongest signal intensity (green), with tracer uptake seen at the outermost periphery of the lesion. Using quantitative analysis, lesion size (measured in mm3 and labeled below each corresponding tumor) can be calculated from PET images.