


Fig. 2. FRET efficiency and maturity of REACh mutants.
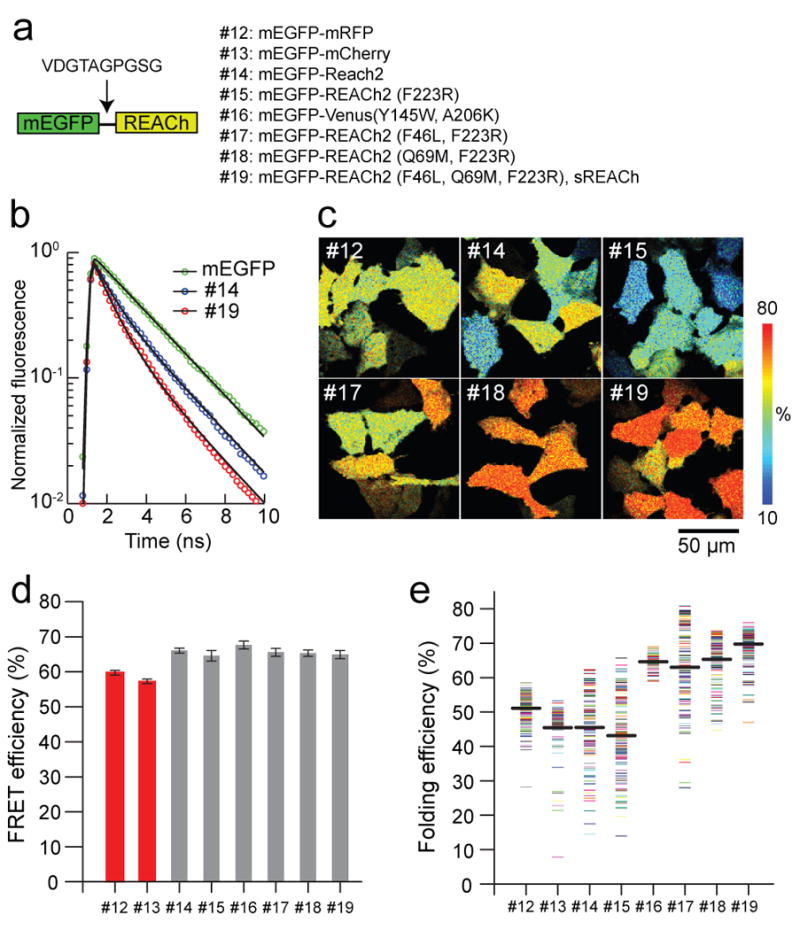
(a) A schematic representation of the structure of the tandem fluorescent protein, and the list of mutants used to evaluate the FRET efficiency and maturation level of REACh mutants.
(b) Fluorescence lifetime curves of mEGFP, mEGFP-REACh2 (#14), and mEGFP-sREACh (#19). Fluorescence lifetime curves were fitted with a double exponential function (Eq. 2), and normalized to F0 (Eq. 2).
(c) Representative folding efficiency images of the mEGFP-mRFP and mEGFP-REACh tandem mutants in HeLa cells. For mutant identities, see (a).
(d) Comparison of the FRET efficiency of the mEGFP-mRFP and mEGFP-REACh tandems. The FRET efficiency of each image was obtained from the fluorescence decay curve averaged over the whole image. The number of images is 29, 20, 20, 22, 25, 20, 22, and 58. Each image contains 6-12 cells. Error bars indicate ± s.d.
(e) Comparison of the binding fraction of mEGFP-mRFP and mEGFP-REACh tandems. Each point represents one cell. Average binding fractions (thick black horizontal bar) are #12, 51.2 ± 4.3; #13, 45.5 ± 7.8; #14, 45.5 ± 10.2; #15, 43.2 ± 11.7; #16,64.6 ± 2.2; #17, 63.0 ± 12.2; #18, 65.3 ± 7.0; and #19,68.6 ± 4.8 (mean ± s.d.). The number of cells is 147, 82, 119, 122, 79, 112, 137, and 159, and 230, respectively.