


Fig. 1.
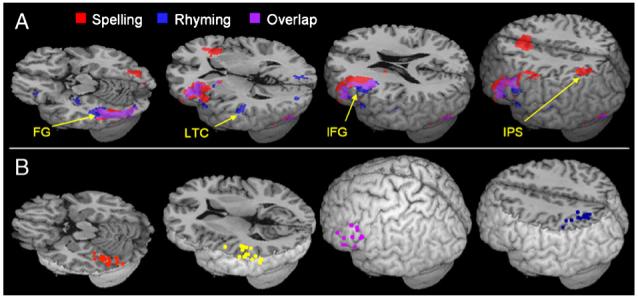
Regions included in the effective connectivity analysis. (A) Group activation for the spelling and rhyming tasks compared to their mean. FG—fusiform gyrus, LTC—lateral temporal cortex, IFG—inferior frontal gyrus, IPS—intraparietal sulcus. (B) Centers of ROIs in individual subjects. Purple—IFG, Orange—FG, Yellow—LTC, Blue—IPS.