


Fig. 2.
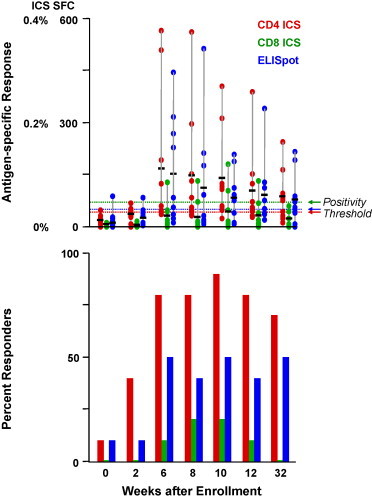
Magnitude and frequency of CD4 and CD8 T-cell responses by ICS and ELISpot analysis at specific timepoints throughout the study. Magnitude of response is represented on the upper graph, percent positive CD4 (red bars) or CD8 cells (green bars) for ICS or spot-forming colonies (SFC) for ELISpot (blue bars). The horizontal black bars represent the mean. A sample was considered positive if it was above the thresholds indicated by the dashed lines. Separate positivity criteria for CD4 and CD8 ICS and ELISpot were developed and validated for overlapping peptide-based stimulations. The frequency of response is represented by percent responders on the lower graph. Weeks after enrollment is shown on the x-axis, applicable for upper and lower graphs. Vaccinations were administered at weeks 0, 4, and 8.