


Fig. 5.
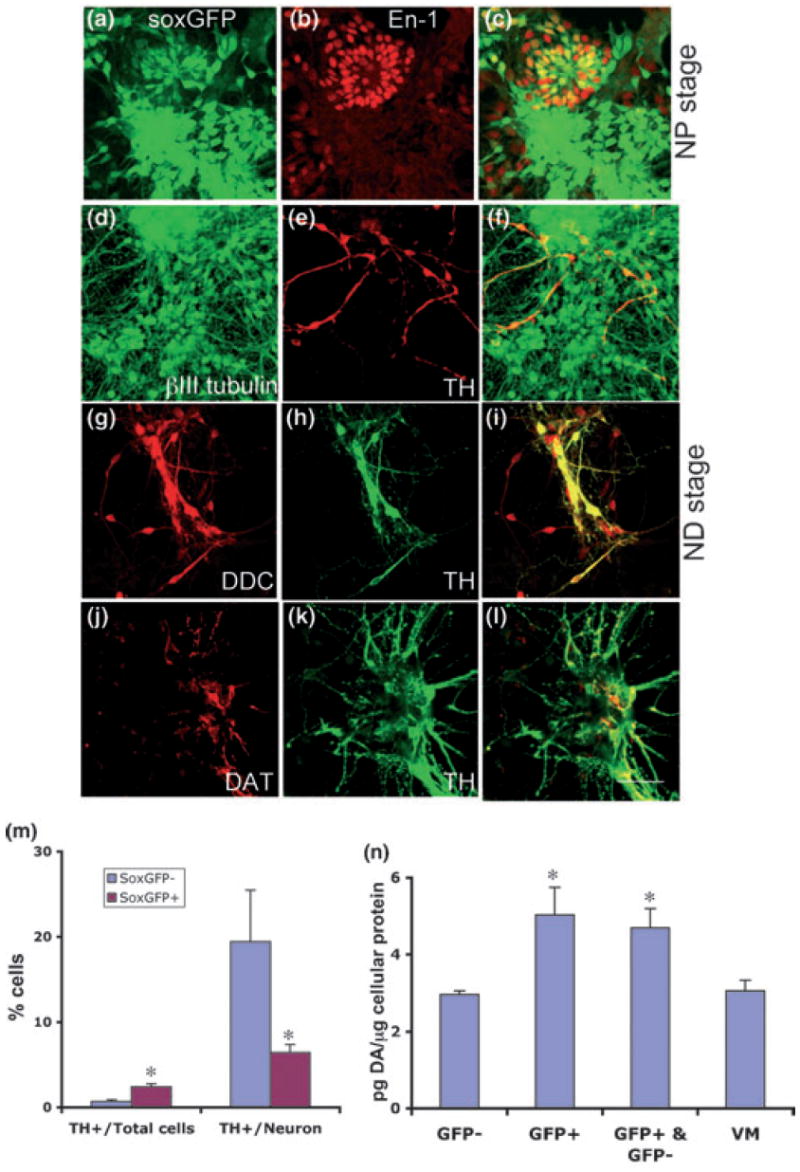
FACS-purified NPs can generate dopaminergic neurons. FACS-purified GFP+ cells were analyzed at the NP stage by immunocytofluorescence using an antibody against the early midbrain marker En-1 (a–c). FACS-purified GFP+ cells were fully differentiated and analyzed by immunocytofluorescence using antibodies against dopaminergic markers such as TH (d–f), DDC (g–i) and DAT (j–l). Shown are representative fields using confocal microscopy at 40× magnification. Scale bar = 50 μm. (m) Fully differentiated sox1-GFP+ cells and sox1-GFP− cells were stained, using antibodies against βIII-tubulin and TH, and counterstained with Hoechst. The numbers of TH+, βIII-tubulin+ and Hoechst+ cells from sox1-GFP− and sox1-GFP+ cells were counted in multiple random fields for each sample, and the proportions of DA neurons among the total number of neurons and total cells were calculated by dividing the numbers of DA neurons by the number of Hoechst+ cells. Each group represents an average of three samples from each independent experiment. For proportion of TH+ cells among neurons, anova revealed F = 4.566, p < 0.05. Fisher’s PLSD post-hoc analysis was performed with a significance level of 0.05; *indicates significant difference from sox1-GFP− cells. For the proportion of TH+ cells among total cells, anova revealed F = 17.364, p < 0.05. Fisher’s PLSD post-hoc analysis was performed with a significance level of 0.05; *indicates significant difference from sox1-GFP− cells. (n) sox1-GFP+ cells and sox1-GFP− cells, after full differentiation, released dopamine in response to membrane depolarization. GFP+ cells, GFP− cells, a mixture of GFP+/GFP− cells and mouse E12.5-derived primary DA cells (VM) were differentiated (stage 5 day 10) and treated with 50 mm KCl for 30 min, then the medium was collected and analyzed for dopamine content by HPLC. anova revealed F = 5.459, p < 0.05. Fisher’s PLSD post-hoc analysis was performed with a significance level of 0.05; *indicates significant difference from GFP− and VM cells.