


Fig. 2.
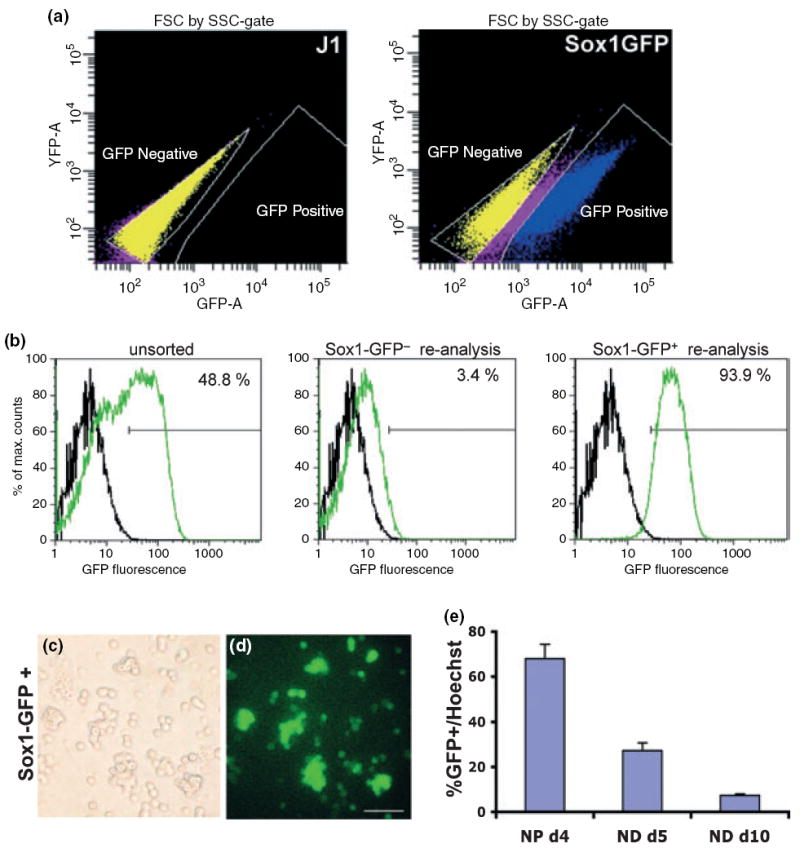
Isolation of sox1-GFP-expressing NPs using FACS. (a) Sox1-GFP ES cells were differentiated to the NP stage, and GFP+ and GFP− cell populations were isolated by FACS. J1 ES cells differentiated the same way were used as negative control. (b) FACS purification of Sox1-GFP precursors was re-analyzed after FACS purification to confirm purity. The black line represents FACS profile of J1 cells as a negative control and the green line represents the samples analyzed. Sox1-GFP+ cells were fixed 2 h after sorting and analyzed by bright field and fluorescent microscopy (c, d) for validation of sorting efficiency. Scale bar = 50 μm. (e) Sox1GFP+ cells were fixed at different time points during in vitro differentiation [4 days after FACS (NP d4), 5 days of neuronal differentiation stage (ND d5) and 10 days of neuronal differentiation stage (ND d10)]. Numbers of GFP+ cells and Hoechst+ cells were counted on multiple random fields for each sample, and the proportion of GFP+ cells was calculated by dividing the number of GFP+ cells by the number of Hoechst+ cells. Each group represents an average of three samples from each independent experiment.