


Figure 2.
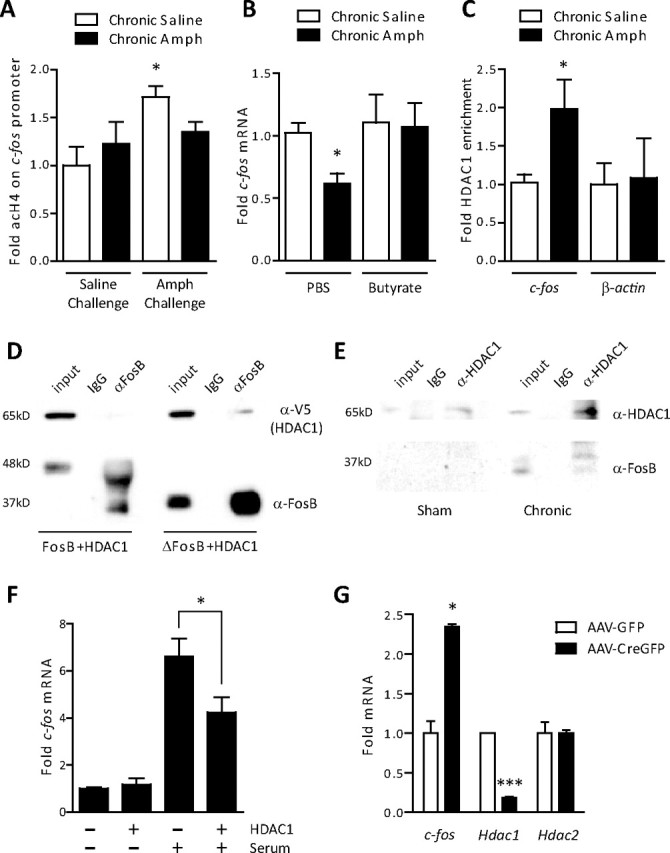
Recruitment of HDAC1 mediates ΔFosB action on c-fos. A, ChIP of striatal lysates revealed a significant increase in acetylated histone H4 on the promoter of c-fos 1 h after a challenge dose of amphetamine in drug-naive rats (ANOVA, significant effect of drug, F(1,12) = 6.26, p < 0.05; Bonferroni post hoc, *p < 0.05; n = 5). This increase was not observed in rats exposed previously to chronic amphetamine (Amph) (p > 0.05). B, The HDAC inhibitor, sodium butyrate (400 mg/kg), reversed the amphetamine-induced reduction in c-fos mRNA observed after 5 d of withdrawal (ANOVA, significant effect of butyrate, F(1,28) = 5.29, p < 0.05; Bonferroni post hoc, chronic amphetamine plus PBS vs chronic saline plus PBS, *p < 0.05, chronic amphetamine plus butyrate vs chronic saline plus PBS or butyrate, p > 0.05; n = 4–9). C, ChIP of striatal lysates revealed significantly more HDAC1 bound to the c-fos promoter (*p < 0.05, Student's t test; n = 5–6), but not the promoter of β-actin (p > 0.05), after 5 d of withdrawal from chronic amphetamine. D, HDAC1 was transfected into PC12 cells with either full-length FosB or ΔFosB. HDAC1 selectively immunoprecipitated with ΔFosB, not full-length FosB. E, In rats that received chronic electroconvulsive seizures (7 daily seizures), a condition known to increase ΔFosB several-fold, immunoprecipitation of HDAC1 pulled down significant levels of ΔFosB. This interaction was not observed in sham-treated animals. Blots are representative of two to three experiments. F, Serum stimulation increased c-fos mRNA significantly less in cells transfected with HDAC1 than with GFP (*p < 0.05; n = 3 independent experiments). G, Floxed HDAC1 mice whose striata were infected with either AAV-GFP or AAV-CreGFP on opposite sides of the brain were treated with chronic amphetamine (7 d, 4 mg/kg) and 5 d of withdrawal. We found significantly higher c-fos expression in cells infected with AAV-CreGFP, where HDAC1 had been floxed out, than in cells expressing AAV-GFP after a 2 mg/kg amphetamine challenge (*p < 0.05; n = 2–3). Significantly less Hdac1 mRNA was observed in AAV-Cre-infected neurons (***p < 0.001), whereas Hdac2 expression was unaffected (p > 0.05). Error bars indicate SEM.