


Figure 5.
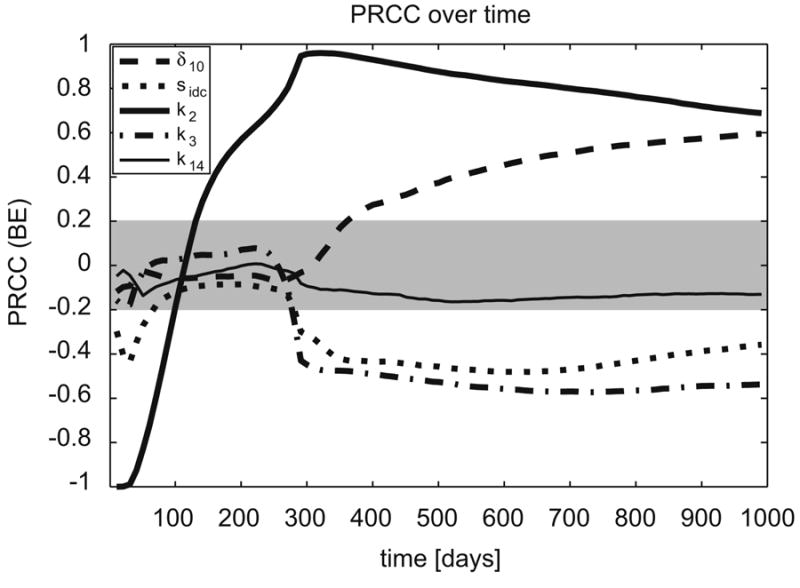
PRCCs of the two compartmental model US analysis performed in section 4.3, plotted over a time course. The gray area represents PRCC values that are not statistically significant. Note how the sensitivity of parameters change as system dynamics progress.