


Figure 5.
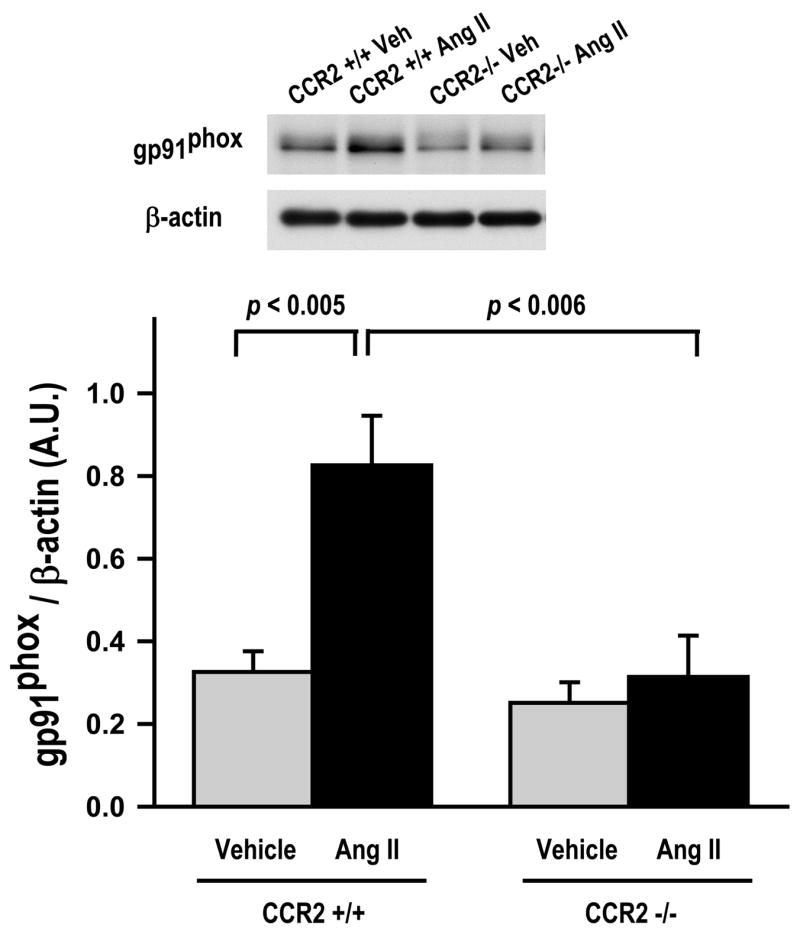
Renal tissue Western blot analysis of gp91phox proteins (Nox2) in mice treated with either vehicle or Ang II. The upper panel shows representative Western blot for gp91phox (58 kDa) and β-actin. The lower panel shows quantification of ratio of gp91phox to β-actin. gp91phox expression increased significantly in CCR2+/+ with Ang II-induced hypertension (p < 0.005, vehicle vs Ang II). gp91phox did not increase in CCR2−/− with Ang II-induced hypertension (p < 0.006, CCR2+/+ Ang II vs CCR2−/− Ang II). gp91phox expression in Ang II-induced hypertension was significantly higher in CCR2+/+ compared to CCR2−/− (p< 0.01; CCR2+/+ vs CCR2−/−). (n=6 per group).