


FIGURE 4.
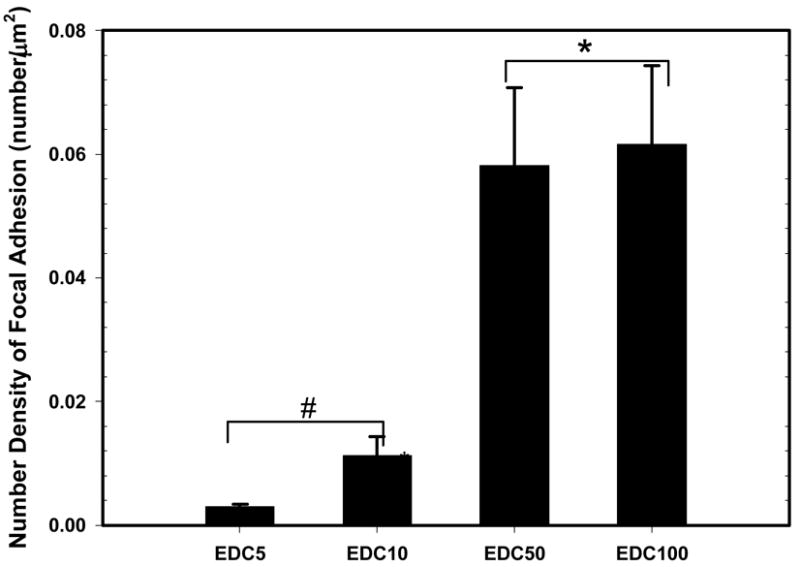
Quantification of the number density of focal adhesions based on the images of Figure 3 (data are means ± standard deviation, SD of three slides). Conditions, which are statistically different can be divided in two groups: (EDC5 and EDC10, #) and (EDC50 and EDC100, *) (p < 0.05).