


Figure 2. Populations of cue-selective neurons of VS and DS recorded in saline- and cocaine-treated rats during discrimination and reversal learning.
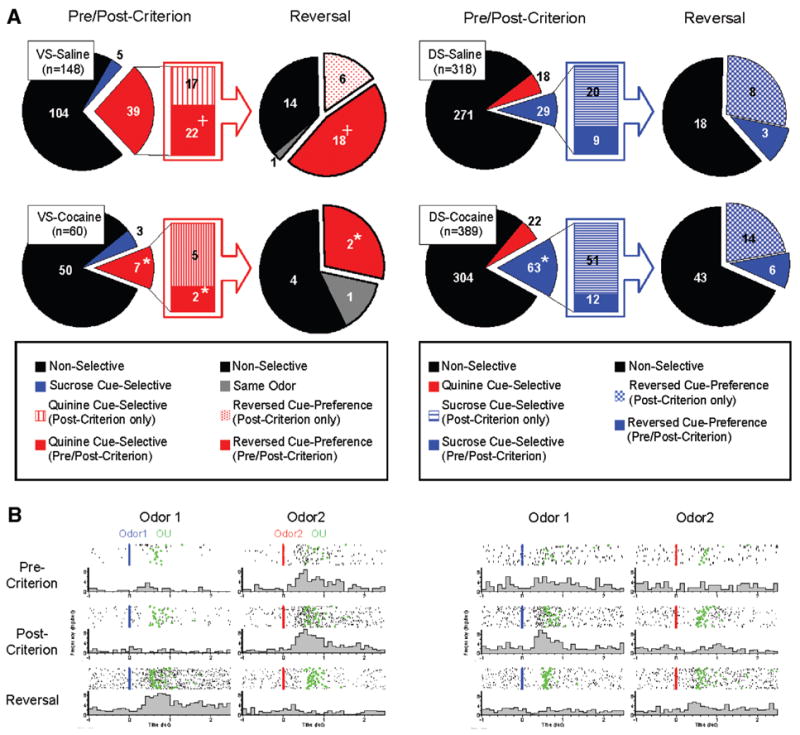
(A) Pie-charts in left side of VS-saline and VS-cocaine groups indicate populations of neurons which show non-selective (black), sucrose cue-selective (blue), and quinine cue-selective (red) firing. Bar-graphs in the middle of VS-saline and VS-cocaine groups indicate population of neurons which show quinine cue-selectivity after post-criterion trials (red stripe) and quinine cue-selectivity in both pre- and post-criterion trials (red). Pie-charts in right side of VS-saline and VS-cocaine groups indicate changes of cue-selectivity of quinine cue-selective VS neurons after reversal. Black indicates neurons which are non-selective after reversal. Red mesh indicates VS neurons which develop quinine cue-selectivity in post-criterion trials of reversal learning. Red indicates VS neurons which show quinine cue-selectivity in both pre- and post-criterion trials of reversal learning. Gray indicates VS neurons which maintained the same cue-selectivity after reversal. Pie-charts in left side of DS-saline and DS-cocaine groups indicate populations of neurons which show non-selective (black), sucrose cue-selective (blue), and quinine cue-selective (red) firing. Bar-graphs in the middle of DS-saline and DS-cocaine groups indicate population of neurons which show sucrose cue-selectivity after post-criterion trials (blue stripe) and sucrose cue-selectivity in both pre- and post-criterion trials (blue). Pie-charts in right side of DS-saline and DS-cocaine groups indicate changes of cue-selectivity of sucrose cue-selective DS neurons after reversal. Black indicates neurons which are non-selective after reversal. Blue mesh indicates DS neurons which develop sucrose cue-selectivity in post-criterion trials of reversal learning. Blue indicates DS neurons which show sucrose cue-selectivity in both pre- and post-criterion trials of reversal learning (*, significant difference from saline group at p <0.05 or better; +, significant difference between VS and DS at p <0.05 or better). (B) Examples of a negative cue-selective VS neuron in saline-treated controls and a positive cue-selective DS neuron in cocaine-treated rats during pre-criterion, post-criterion and reversal trial. Activity is shown synchronized to the onset of odor1 (Blue) or odor2 (Red). Activity is displayed in raster format at the top and as a peri-event time histogram in spikes/second in 100 ms bin at the bottom of each panel. Green indicates nose-unpoke from the odor port.