


Figure 5.
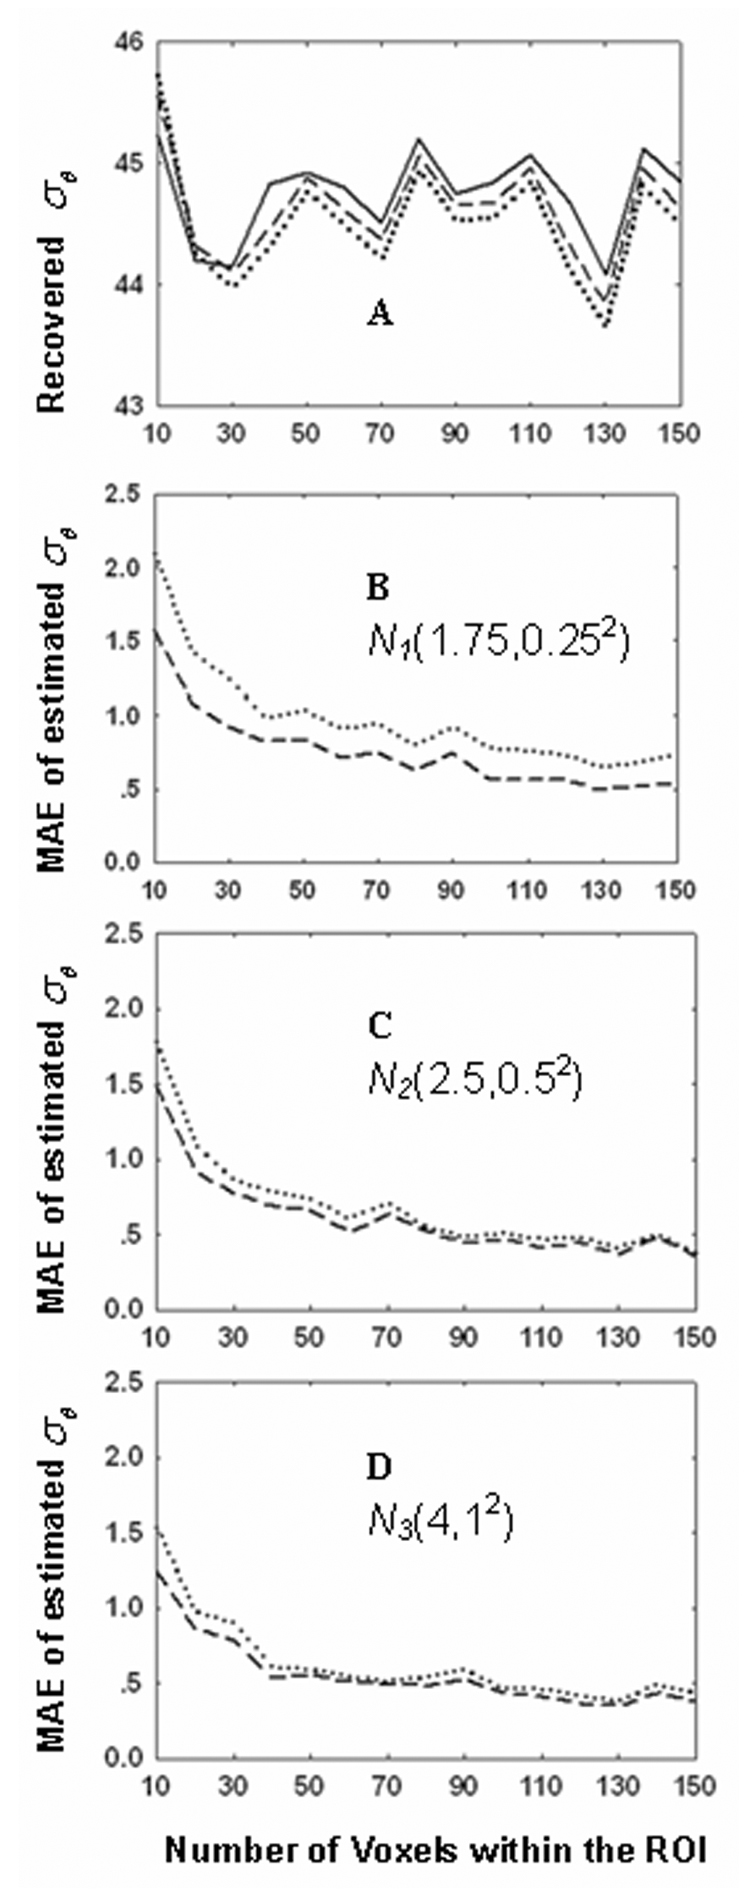
Simulation of independence of the PSI estimation on the SNRs. In Fig 5A three sets of simulations are implemented to examine the impact of the approximation between Eq. (14) and Eq. (15) in case of the noise-free condition. The solid line, the dashed line, and the dotted line represent the given σθ and estimated from Eq. (15) and Eq. (14), respectively. Figs. 5B–5D showed the MAEs of estimated based on Eq. (14) (dotted line) and Eq. (15) (dashed line) at three different SNR distributions. The vertical units for Figs. 5A–5D are all in degrees.