


Figure 2. Gene expression profile of EGF family members.
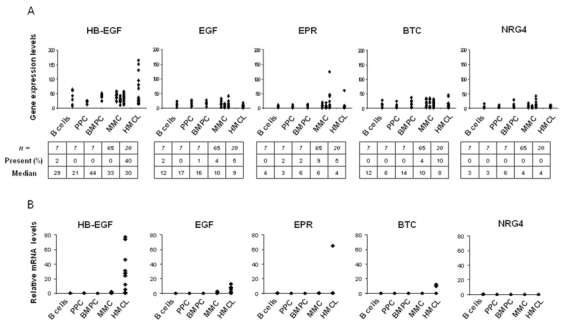
A. Gene expression profiles were determined in B cells, PPC, BMPC, MMC of 65 patients and 20 HMCLs. Data from MM patients are presented with 3 columns. The left, middle and right columns correspond to MMC from patients at stage I, II or III, respectively. Statistical comparisons were made with a Mann-Whitney test. Percentages of presence and median values calculated over all samples are indicated under each graphic. B. Real-time RT-PCR analysis was completed as described in material and methods.