


Fig. 3.
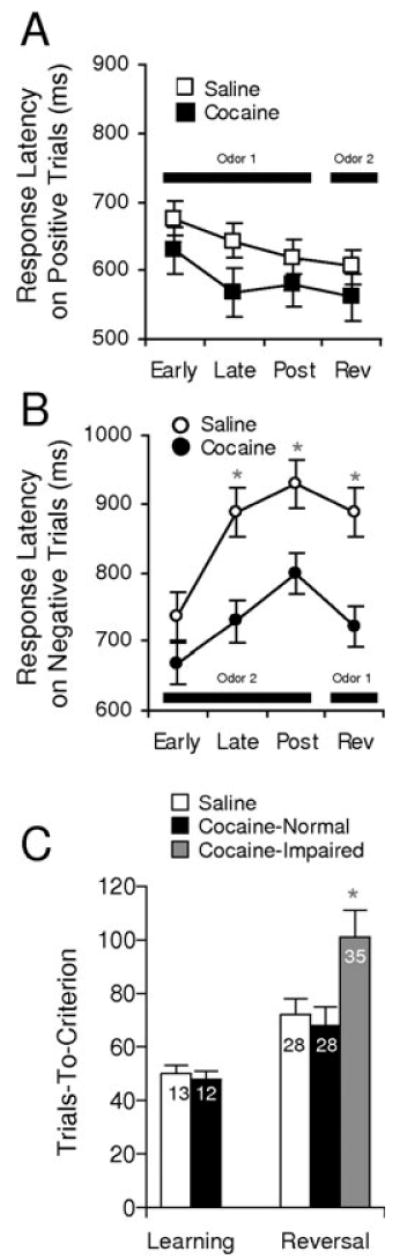
Behavioral performance in saline- and cocaine-treated rats. (A and B) Latencies to enter the fluid well when a decision was made to respond on positive (A) and negative (B) trials. Response latencies were calculated as the time from leaving the odor port until entry into the fluid well and are shown separately for trials early and late in the pre-criterion phase and post-criterion. This calculation did not consider no-go trials. Cocaine-treated rats failed to develop the normal increase in latency to respond on negative trials during learning and also after reversal. (C) Bars show trials required to attain the go, no-go performance criterion of 18 correct responses in a moving block of 20 trials, during initial learning and after reversal. Numbers on the bars indicate errors to criterion. For reversal, data are shown separately for sessions from cocaine-treated rats that performed poorly compared with saline-treated controls. (*, significant difference at P < 0.05 or better)