


Figure 3. [Na+]i signals from wild-type and mdx muscle fibres following isometric and eccentric contractions.
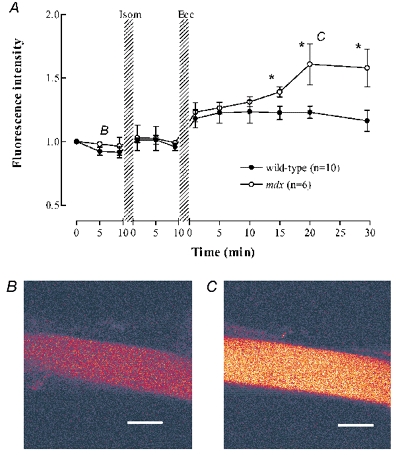
A, sodium green fluorescence normalized to the starting point of each experiment. Wild-type (filled symbols), mdx (open symbols). * Significant difference between wild-type and mdx. The rise in fluorescence after the eccentric contractions was statistically significant for both wild-type and mdx fibres. B and C, representative images of the sodium green fluorescence from one mdx fibre at the times indicated by the B and C labels on panel A. Scale bar 25 μm.