


FIGURE 6. ITC of n1α_LNS#2 splice isoforms.
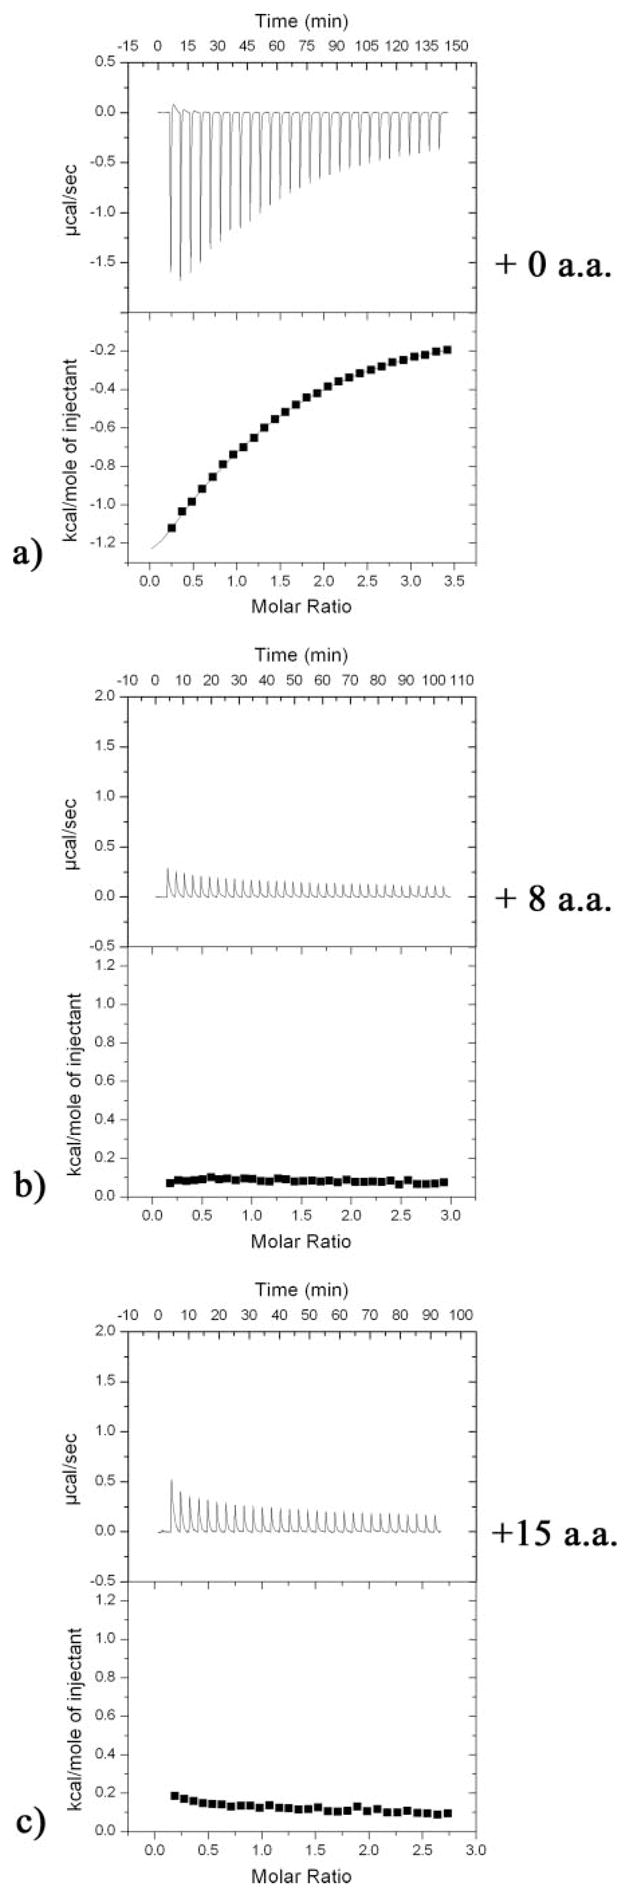
The titrations were carried out as described under “Experimental Procedures.” For each splice isoform: the top figure shows the calorimetric titration of 5-μl injections of a 11.518 mm CaCl2 solution into protein; the bottom figure shows the normalized binding isotherm displaying heat absorbed/released per kilocalorie/mol of CaCl2 injected as a function of molar ratio metal:protein (squares), with the best least-squares fit to a binding model for one site (solid line) superimposed. For each run the heat of dilution of the CaCl2 solution has been subtracted (measured with a titration of CaCl2 into flow-through buffer alone). a, n1α_LNS#2.