


Figure 2. Correlation between the Mn2+ quenching rate and the cytosolic [Ca2+] in normal and mdx fibres.
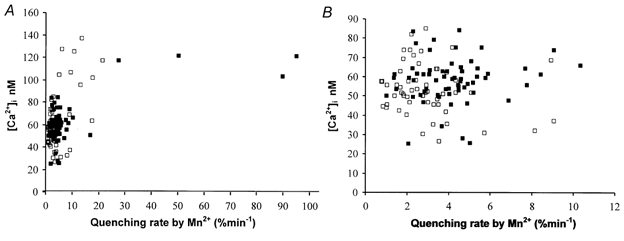
A, individual correlation between the Mn2+ quenching rate and the cytosolic [Ca2+] for 130 paired measurements (62 normal fibres, 68 mdx fibres, from data plotted in Fig. 1). B, expanded view of the cluster of 116 individual paired measurements at the far left of Fig. 2A (53 normal fibres, 63 mdx fibres). □, normal fibres; ▪, mdx fibres.