


Figure 3. Phase relation of single cell responses vs. field rhythms.
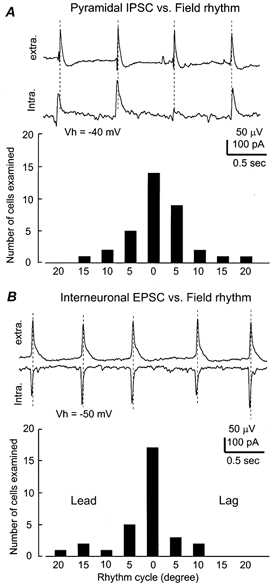
A top, simultaneously collected field rhythm and pyramidal IPSCs from a 24-day-old mouse hippocampal isolate. The pyramidal neuron was voltage clamped at −40 mV. Dashed lines were drawn to mark the peaks of the rhythmic field potentials. Bottom, summary of the phase relation of pyramidal cell IPSP/IPCS vs. the field rhythms. X-axis, rhythm cycle binned every 5 deg, taking the peak of rhythmic field potentials as reference (zero-phase shift). Y-axis, number of neurons within each bin. B top,CA1 field rhythms and interneuronal EPSCs simultaneously recorded from a 22-day-old hippocampal isolate. The interneuron was voltage clamped at −50 mV. Bottom,the phase relation of interneuronal EPSPs/EPSCs vs. field rhythms.