



Abstract
Solid-state NMR measurements performed on intact whole cells of S. aureus labeled selectively in vivo have established that des-N-methylleucyl oritavancin (which has antimicrobial activity) binds to the cell-wall peptidoglycan, even though removal of the terminal N-methylleucyl residue destroys the D-Ala-D-Ala binding pocket. By contrast, the des-N-methylleucyl form of vancomycin (which has no antimicrobial activity) does not bind to the cell wall. Solid-state NMR has also determined that oritavancin and vancomycin are comparable inhibitors of transglycosylation, but that oritavancin is a more potent inhibitor of transpeptidation. This combination of effects on cell-wall binding and biosynthesis is interpreted in terms of a recent proposal that oritavancin-like glycopeptides have two cell-wall binding sites: the well-known peptidoglycan D-Ala-D-Ala pentapeptide stem terminus, and the pentaglycyl bridging segment. The resulting dual mode of action provides a structural framework for coordinated cell-wall assembly that accounts for the enhanced potency of oritavancin and oritavancin-like analogues against vancomycin-resistant organisms.
Keywords: Glycopeptide antibiotic, peptidoglycan, solid-state NMR, transglycosylase, transpeptidase
Introduction
The emergence of vancomycin resistance in Staphylococcus aureus and its increasing prevalence in enterococci demand the development of new antimicrobial drugs. The first clinical isolate of S. aureus with reduced susceptibility to vancomycin, with a minimum inhibitory concentration (MIC) equal to 8 μg/mL (5 μM), was characterized in Japan in 1996,1 eight years after the identification of vancomycin-resistant enterococci.2 In 2002, a vancomycin-resistant S. aureus (VRSA) isolate with an MIC>128 μg/mL (86 μM), and a vancomycin-resistant E. faecalis, were recovered from a patient in Michigan who was being treated with multiple courses of antibiotics.3 The VRSA isolate had acquired the vanA vancomycin-resistance gene cluster found in enterococci that codes for the production of D-Ala-D-Lac stem termini.4 Oritavancin (Figure 1, left column), a vancomycin analogue now in clinical development,5–7 is effective against vancomycin-resistant organisms. As the need for new antibiotics in the clinic grows, understanding on a molecular level the modes of action of oritavancin and other vancomycin analogues, and their ability to overcome vancomycin resistance, are critical to the success of future drug development.
Figure 1.

Chemical structures of four glycopeptides (left column) and their des-N-methylleucyl forms (right column). The terminal leucyl residue of the aglycon core of each glycopeptide is highlighted. Minimum inhibitory concentrations for the growth of vancomycin-susceptible Gram-positive bacteria (see Methods) are in red.
Glycopeptide antibiotics, including vancomycin, exert their therapeutic activity by inhibiting the peptidoglycan biosynthesis of the bacterial cell wall (Figure 2) of Gram-positive bacteria.8 Cell-wall thinning results from vancomycin treatment9 because new cell-wall synthesis at the cell-membrane surface is curtailed while enzymatic degradation of outer layers (which normally functions to accommodate cell growth and division) is unaffected. The antibiotics do not penetrate into the cytoplasm of the cell but form complexes with the D-Ala-D-Ala carboxyl termini of peptidoglycan pentapeptide stems on the extracellular side of the membrane,10–12 including peptidoglycan precursor Lipid II, in which the peptidoglycan repeat unit is covalently linked to a C55-lipid transporter (Figure 3).
Figure 2.

Chemical structure of a peptidoglycan fragment of S. aureus. The five-residue stem on the right has no cross-link to its D-Ala-D-Ala terminus.
Figure 3.

Schematic representation of peptidoglycan biosynthesis in S. aureus. A new glycan strand is shown forming at the membrane surface. Transglycosylation inserts Lipid II into this strand. The transformation of immature cell wall to mature (cross-linked) cell wall occurs through transpeptidation. The terminal peptide-stem D-alanine is removed upon transpeptidation. Three representative cross-links are illustrated.
Transglycosylation and transpeptidation are both essential for the synthesis of new cell wall. The former extends the glycan chain and the latter cross-links the peptide stems with the concomitant elimination of the terminal D-Ala. Stable-isotope labeling and solid-state NMR experiments performed on intact S. aureus cells were used to measure the extent of transglycosylation and transpeptidation in the presence of vancomycin.13 These determinations were made by monitoring the metabolic pools of peptidoglycan precursors, particularly the accumulation of cytoplasmic peptidoglycan precursors (Park’s nucleotide) with no pentaglycyl bridges attached, relative to the density of mature peptidoglycan stem cross-links. For rapidly dividing cells in the presence of vancomycin, the number of bridge-links decreased while the number of cross-links per bridge stayed approximately constant. Thus, vancomycin inhibits transglycosylation in S. aureus before any significant effect on transpeptidation is observed, consistent with (i) no new production of glycan chains and the accumulation of Park’s nucleotide, (ii) continued cross-linking of existing immature peptidoglycan, and (iii) normal degradation of outer cell walls.13 These results were in agreement with early pioneering work detailing antibiotic modes of action in the 1960’s by Strominger and colleagues, in which radioisotope labeling was employed to track the fate of cell-wall components during treatment with antibiotics such as vancomycin, ristocetin, bacitracin, and penicillin.14–16
Of the hypotheses regarding the mode of action of oritavancin in Gram-positive bacteria, the sequestration of Lipid II is generally accepted, with enhanced activity over vancomycin resulting either from improved binding to stem termini through drug dimerization or membrane anchoring,17 the latter via the hydrophobic biphenyl moiety of the drug. Although oritavancin forms dimers in vitro, solid-state NMR measurements of intact whole cells have not detected dimers or membrane anchoring.18,19 These results suggest that an understanding of the mechanisms of action of the drug must rely on direct characterizations of the effects of glycopeptide binding on peptidoglycan biosynthesis with the full complexity of the peptidoglycan network in place, to reveal the subtleties of the interactions between the drug and the biological system.
Recently we used rotational-echo double-resonance (REDOR) NMR20 of [19F]oritavancin (biphenyl Cl replaced by F, Figure 1, left column) and vancomycin, eremomycin, and chloroeremomycin derivatives bound to isolated cell walls and intact whole cells of S. aureus.19 The substitution of F for Cl has no substantive pharmacological effect21 at the molecular level and provides a useful NMR probe.18,22 REDOR was used to measure dipolar couplings between 19F of the drugs, and 13C, 2H, and 15N labels incorporated in peptidoglycan stems and bridging pentaglycyl segments. The resulting 13C-19F, 13C-2H, and 15N-19F distances from the REDOR experiments were used to determine the locations of the hydrophobic disaccharide substituents with respect to the pentaglycyl bridge of the bound peptidoglycan, and to build model structures for five glycopeptide-peptidoglycan complexes.19 Correlation of the model structures and antibiotic activity led to the conclusion that the hydrophobic substituent of the drug disaccharide and components of the aglycon structure form a secondary binding site for pentaglycyl segments in S. aureus. We then proposed that this secondary binding site compensated for the loss of binding affinity to D-Ala-D-Lac stem termini, and thus allowed such disaccharide-modified glycopeptides to maintain their activity against VRSA.
In this report, we present experimental proof of such a secondary binding site by solid-state NMR detection of S. aureus cell-wall binding of des-N-methylleucyl-[19F]oritavancin, a vancomycin analogue modified by Edman degradation (Figure 1, right column). The Edman degradation of vancomycin itself removes the N-terminal N-methylleucyl residue from the aglycon core, destroys the D-Ala-D-Ala binding pocket, and increases the minimum inhibitory concentration of the drug to more than 1000 μg/mL (670 μM).23 We also use solid-state NMR results to elucidate changes in peptidoglycan structure and in the accumulation of metabolic precursors in S. aureus cells treated by oritavancin during exponential growth. In addition, we compare these effects with those resulting from penicillin and vancomycin treatments to determine relative inhibition of transglycosylation and transpeptidation during drug treatment. Integration of all of these results leads to the suggestion of a dual mode of action for oritavancin that accounts for its potency against vancomycin-resistant organisms, and its retention of antimicrobial activity following removal of the terminal N-methylleucine from the aglycon core.
Results
Des-N-methylleucyl-[19F]oritavancin cell-wall binding
The 13C{19F} REDOR dephasing for whole cells of S. aureus labeled by D-[1-13C]alanine and complexed by des-N-methylleucyl-[19F]oritavancin is consistent with a 7.7-Å 13C-19F distance (Figure 4, left). This is within 1 Å of the distance determined for the corresponding complex with [19F]oritavancin.18 In addition, REDOR dephasing for the des-N-methylleucyl-[19F]oritavancin and [19F]oritavancin complexes with whole cells labeled by [1-13C]glycine indicate similar distances from the fluorine of the drug to the nearest-neighbor pentaglycyl bridging segment (Figure 4, right). These results are only consistent with binding of des-N-methylleucyl-[19F]oritavancin, to the cell wall of S. aureus in approximately the same location as the binding of [19F]oritavancin despite the lack of affinity of the former for a D-Ala-D-Ala stem terminus. The two locations are not identical, however. The 15N{19F} dephasing of the amide peak of the des-N-methylleucyl-[19F]oritavancin complex with whole cells labeled by L-[ε-15N]lysine (Figure 5) shows proximity of the fluorine to a bridge link (see Figure 2). This result moves the fluorine of des-N-methylleucyl-[19F]oritavancin off the helix axis of the pentaglycyl bridging segment (Figure 6).
Figure 4.

50.3-MHz 13C{19F} REDOR dephasing (ΔS/S0) for complexes of des-N-methylleucyl-[19F]oritavancin and whole cells of S. aureus grown on media containing D-[1-13C]alanine and a racemase inhibitor (left, solid circles) and [1-13C]glycine (right, open circles). The calculated dephasing for a single 19F-13C distance to the nearest cross-link accounts for the D-alanyl dephasing (left, solid line). The calculated dephasing assuming the five distances of a single compact helix for the pentaglycyl bridge matches the experimental glycyl dephasing (right, solid line). The glycyl dephasing is also compared to that observed (reference 19) for a similar complex with [19F]oritavancin (right panel, dotted line).
Figure 5.
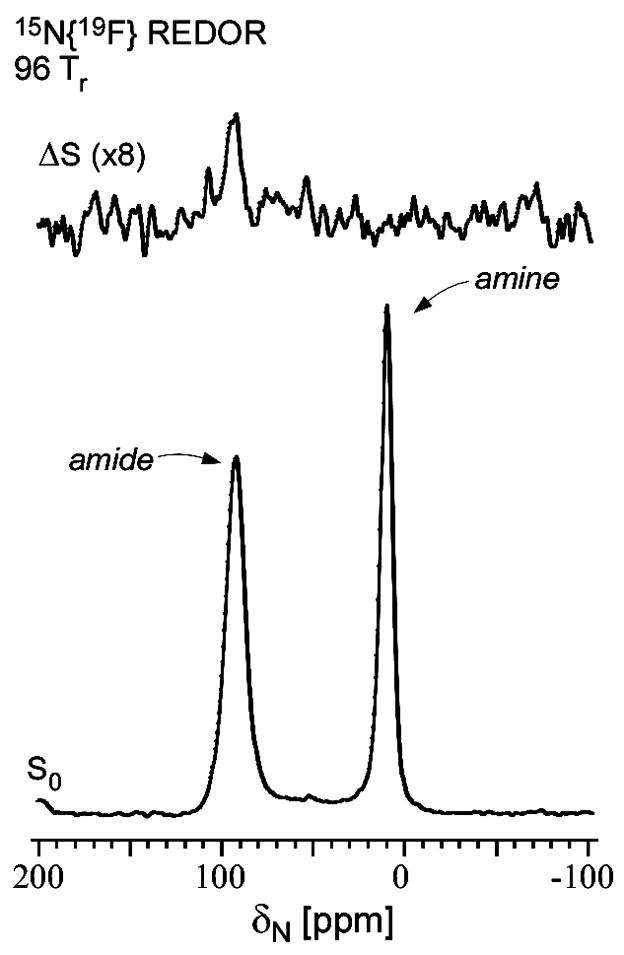
20.3-MHz 15N{19F} REDOR spectra of a complex of des-N-methylleucyl-[19F]oritavancin and whole cells of S. aureus grown on media containing L-[ε-15N]lysine. The full-echo spectrum (S0) is shown at the bottom of the figure, and the REDOR difference (ΔS = S0 – S, where S and S0 are the spectra observed with and without 19F dephasing pulses, respectively) at the top of the figure. The presence of a REDOR difference at 95 ppm indicates the proximity of 19F to the bridge link (see Figure 2). A REDOR difference for the corresponding complex with [19F]oritavancin is not observed (reference 19). The spectra were the result of the accumulation of 20,000 scans. Magic-angle spinning was at 5 kHz.
Figure 6.

Possible positions of fluorine relative to the bridging pentaglycyl helix in the peptidoglycan complex of des-N-methylleucyl-[19F]oritavancin. The pentaglycyl bridge is shown in an α-helical conformation with the carbonyl carbons in black, α carbons in gray, nitrogens in blue, and oxygens in red. The positions that are consistent with the REDOR dephasing of Figure 4 (right, open circles) are indicated by small dots whose colors (inset) indicate the root-mean-square deviation between calculated and experimental dephasing. The best match that is also consistent with the 15N{19F} dephasing of Figure 5 places the fluorine of des-N-methylleucyl-[19F]oritavancin away from the helix axis (arrow). The position of fluorine in the [19F]oritavancin complex with peptidoglycan (red dot) is on the helix axis.
Whole-cell metabolic pools by 15N and 13C NMR
15N NMR spectra of drug-treated S. aureus grown in the presence of L-[15N]lysine (Figure 7, bottom) indicate that after addition of [19F]oritavancin, the relative lysyl-amide-peak intensity decreases and the amine-peak intensity increases. These effects are similar to the changes observed when cells are grown in the presence of vancomycin.13 Lysyl sidechain amides are present in the cell wall and Lipid II and directly reflect lysines that are bridge-linked to pentaglycyl bridging segments.
Figure 7.

Oritavancin influence on glycine and lysine metabolism. (Top) 125-MHz 13C CPMAS comparison of actively dividing whole cells of S. aureus labeled by [13C]glycine with (right) and without (left) [19F]oritavancin treatment. (Bottom) 50-MHz 15N CPMAS comparison of actively dividing whole cells of S. aureus labeled by L-[ε-15N]lysine with (right) and without (left) [19F]oritavancin treatment. The 15N spectra have been scaled by whole-cell mass.
Most glycine is incorporated into the pentaglycyl bridges of the cell wall peptidoglycan but some label is routed into RNA during purine synthesis.13 Changes in glycyl-label incorporation are apparent in the 13C spectrum upon drug treatment (Figure 7, top). The loss of purine intensity in the 13C spectrum observed for [19F]oritavancin-treated cells was also observed for vancomycin-treated cells,13 and is consistent with the rerouting of glycine to cell wall biosynthesis and the resulting suppression of purine metabolism under antibiotic-induced pressure.
Cross-links by 15N{13C} and 13C{15N} REDOR
Cells of S. aureus were grown in media containing D-[1-13C]alanine, [15N]glycine, and an alanine racemase inhibitor, to identify peptidoglycan cross-links and to monitor the influence of drug-treatment on cell-wall metabolism. A 13C-15N labeled bond occurs only for a cell-wall cross-link, between D-Ala and the pentaglycyl bridge (Figure 2), and permits NMR detection without background contributions in whole cells.
Vancomycin, penicillin, and [19F]oritavancin were added to cells during exponential growth and cells were harvested, frozen, and lyophilized for examination by NMR. The glycyl-amide region at about 85 ppm of the 15N{13C} REDOR spectra of the lyophilized whole cells are shown in Figure 8. REDOR differences after 8 rotor cycles for each of the drug-treated samples are compared to the control in the inset. The diminution of the REDOR difference is a direct measure of the change in cell-wall cross-links per pentaglycyl bridging segment as a result of the action of the drug. Vancomycin has the least effect of the three drugs and penicillin the largest effect.
Figure 8.

A comparison of inhibition of cross-linking from the 30.4-MHz 15N{13C} REDOR spectra of whole cells of S. aureus grown on media containing [15N]glycine and D-[1-13C]alanine and a racemase inhibitor (control, black), plus therapeutic doses of penicillin (blue), [19F]oritavancin (green), or vancomycin (red). Full-echo spectra normalized to the control are shown at the bottom of the figure and REDOR differences at the top. The REDOR difference measures the relative number of cross-links per peptidoglycan pentagycyl bridging segment. Vancomycin has the least effect on cross-linking and penicillin the largest effect.
The relative numbers of cross-links in the same drug-treated whole-cell samples were also measured by 13C{15N} REDOR NMR. A complication in this determination is that a variable part of the D-[1-13C]alanine label appears in teichoic acids.22 Thus, the 175-ppm carbonyl-carbon 13C{15N} full-echo signal has a contribution from cell-wall peptidoglycan and a variable contribution from teichoic acids and is not appropriate for scaling of the REDOR differences. Instead, we used the 70-ppm sugar peak13 whose intensity is dominated by contributions from the cell-wall sugars. The 13C{15N} REDOR experiment therefore measures approximately the change in cell-wall cross-links per peptidoglycan repeat as a result of drug action (Table 1). By this assay, vancomycin has the least effect of the three drugs on cross-linking, penicillin the largest effect, and oritavancin an intermediate effect, the same ranking as observed in Figure 8. These results are fully consistent with the REDOR results reported earlier for vancomycin13 and with the radiolabel results reported by Strominger and co-workers for vancomycin and penicillin.14,15
Table 1.
| control | vancomycin | oritavancin | penicillin |
|---|---|---|---|
| 1.00 | 0.87 | 0.64 | 0.42 |
drug added to S. aureus in exponential growth.
from 175-ppm 8-Tr 13C{15N} REDOR difference (ΔS) for whole cells labeled by D-[1-13C]alanine and [15N]glycine in the presence of a racemase inhibitor.
total of mature and immature peptidoglycan from 70-ppm 13C full-echo (S0) sugar peak. (See Figure 4 of reference 13.)
estimated accuracy from peak intensities of ± 10%.
D-Ala Quantitation by 13C{15N} REDOR
The full-echo 13C{15N} spectra (Figure 9) of the four samples labeled specifically by D-[1-13C]alanine and [15N]glycine (Figure 8) have contributions from four types of carbonyl carbons:19,22 (i) the peptide carbonyl in cross-linked stems ending in D-Ala (blue); (ii) the peptide carbonyl of D-Ala-4 of D-Ala-D-Ala stems (red); (iii) the D-Ala-5 terminal carboxyl of those stems (red); and (iv) various teichoic acid D-Ala esters (green). The full-echo spectrum for each sample is shown in black.
Figure 9.

Complete accounting of whole-cell D-alanine. Experimental deconvolution of the normalized 75.5-MHz carbonyl-carbon spectra of the four S. aureus samples of Figure 8 are shown, with a structure color coding indicated in the top spectrum. Total label incorporation was 1.00 for the control and 0.53, 0.37, and 0.72 for the vancomycin, oritavancin, and penicillin-treated cells, respectively.
Each spectrum can be experimentally deconvoluted to reveal individual 13C contributions. Cross-linked D-Ala is selected directly by 13C{15N} REDOR to identify D-Ala carbonyl carbons cross-linked to glycine.22 This 13C{15N} REDOR difference spectrum scaled by the 15N isotopic enrichment of glycine13; 24 is shown in solid blue and arises from the cross-linked stems ending in a single D-Ala. The difference between the two experimental spectra (black and blue) is shown in dotted black. The dotted black spectrum lacks any contribution from cross-linked stems and results from 13C of the remaining D-Ala in whole cells: D-Ala-D-Ala pairs (from the cell wall and from cytoplasmic Park’s nucleotide) and D-Ala in teichoic acid.
The D-Ala-D-Ala contribution to the dotted black spectrum can be separated from the D-Ala contribution of teichoic acid. The carboxyl component from the terminal D-Ala is shifted downfield by about 3 ppm from the 175-ppm penultimate D-Ala carbonyl carbon to 178 ppm.22 This peak must have the same relative intensity as the 175-ppm contribution, a conclusion based on stoichiometry. The blue peak provides a good model for the shift and lineshape of both peptide components from stems ending in D-Ala-D-Ala (Figure 9, top). Thus, the full deconvolution depends on only one fitting parameter: the scaling of the intensity of the D-Ala-D-Ala pair of peaks (red in Figure 9) relative to that of the total spectrum. Because no other D-Ala pool results in peak intensity at 178 ppm (esterified D-Ala in teichoic acids appears near 171 ppm), the two red peaks were scaled such that their subtraction from the dotted black spectrum left minimal residual spectral intensity at 178 ppm. The resulting difference peak in green reveals the intensity due to teichoic acid D-Ala and is consistent with previous quantitative determinations using the same deconvolution protocol.22 The absence of intensity of the green spectrum at 175 ppm is a confirmation that in general, in the presence of racemase inhibitor, there was no major scrambling of label from D-Ala to L-Ala, although minor scrambling for the vancomycin-treated cells is apparent (Figure 9, lower left).
The ratio of red to blue intensities at 175 ppm in Figure 9 is the fraction of stems ending in D-Ala-D-Ala relative to those ending in D-Ala. This ratio increased from 0.45 for the control, to 1.0, 1.2, and 1.3 for the penicillin-, vancomycin-, and [19F]oritavancin-treated cells, respectively.
Discussion
Secondary binding site for oritavancin-like glycopeptides
A space-filling model reflecting the label positions of the des-N-methylleucyl-[19F]oritavancin cell wall complex of Figures 4–6 reveals the shape of the secondary binding site (Figure 10, right). The model is patterned after those used to describe the cell-wall complexes of vancomycin, eremomycin, and oritavancin.19 Binding of des-N-methylleucyl-[19F]oritavancin to a cell-wall peptide stem and its attached pentaglycyl bridging segment is stabilized by interactions with components of the aglycon core of the drug, and with its disaccharide, fluorobiphenyl, and 4-epi-vancosamine substituents. Removal of any of these three moieties reduces the potency of the drug.19
Figure 10.

Space-filling model of the des-N-methylleucyl-[19F]oritavancin complex with the peptidoglycan of S. aureus (right), consistent with the results of Figures 4–6. The drug is in dark gray and the peptidoglycan components in light gray. The corresponding complex with [19F]oritavancin (left) has slightly altered positions of the D-Ala-D-Ala stem terminus and the fluorobiphenyl moiety.
Inhibition of transglycosylation and transpeptidation by oritavancin
The one-dimensional spectra in Figure 7 provide snapshots of the glycine and lysine metabolic pools in untreated and oritavancin-treated S. aureus. Oritavancin shares with vancomycin the capacity to block transglycosylation of wild-type S. aureus via binding of Lipid II.13 Sequestration of Lipid II blocks glycan chain extension at the membrane exoface, halting the synthesis of new Lipid II, ultimately resulting in the decreased lysyl amide-peak intensity (Figure 7, bottom right) from degradation of old peptidoglycan at the cell surface. Immediate precursors of Lipid II (predominantly Park’s nucleotide) accumulate in the cytoplasm, yielding the increased lysyl amine-peak intensity. This combination is the unambiguous NMR signature of inhibition of transglycosylation.13
Interruption of cell-wall cross-linking still permits Lipid II turnover at the membrane exoface, thereby maintaining bridge-link density. As a result, penicillin-treated cells continue to add immature glycan strands and more pentaglycyl segments to the cell wall25 but do not cross-link them. Thus, cross-linking, measured by counting the number of glycine-D-Ala bonds via 15N{13C} dephasing after eight rotor cycles, relative to the number of pentaglycyl segments, decreases for the penicillin-treated cells (Figure 8).
The vancomycin-treated cells on the other hand, stop extracellular peptidoglycan assembly completely, lose cell-wall mass and cross-links to active degradation but add some cross-links by transpeptidase activity on nascent peptidoglycan. Relative to the number of pentaglycyl segments remaining, the vancomycin-treated cells show the smallest decrease in cross-linking per pentaglycyl bridge (Figure 8). Thus, by 15N{13C} REDOR, vancomycin has the least effect on cross-linking, and penicillin the largest effect. The same ranking is reached using 13C{15N} dephasing after eight rotor cycles scaled by the total number of peptidoglycan repeats (Table 1). Oritavancin has an intermediate effect on cross-linking as measured by both 15N{13C} and 13C{15N} REDOR, suggesting inhibition of both transglycosylation and transpeptidation.
Dual mode of action by accurate counting of D-Ala
Inhibition of both transglycosylation and transpeptidation for oritavancin is consistent with a complete accounting of D-Ala in wild-type and antibiotic-induced cell walls. Inhibition of transpeptidase by penicillin decreased cross-linking, and so increased the ratio of stems ending in D-Ala-D-Ala (uncross-linked) to those ending in D-Ala (cross-linked) from 0.45 for the control to 1.0 (Figure 9). This ratio was 1.2 for the vancomycin-treated cells as inhibition of transglycosylation accumulated D-Ala-D-Ala terminated stems in Park’s nucleotide (Figure 7), and degradation of old cell walls at the cell surface lost stems ending in D-Ala. The ratio of stem endings was 1.3 for oritavancin-treated cells (Figure 9), consistent with the same gains and losses as for vancomycin treatment, and an additional decrease in stems ending in D-Ala from a decrease in cross-linking (Figure 8 and Table 1). This dual mode of action for oritavancin is inconsistent with the proposal that the activity of the drug is exclusively the result of binding to, and inhibition of, a glycosyl transferase, the penicillin-binding protein PBP2.26
Structural and functional molecular model
We suggest that a glycan chain in S. aureus must be initiated with a nearest-neighbor chain as a template to ensure the correct orientation of stems that are to be cross-linked.19 The notion of a template in the production of cell-wall peptidoglycan has been proposed before. H ltje has suggested that in E. coli, a replicase holoenzyme attaches to a docking or template glycan strand and synthesizes three new strands which are cross-linked as the enzyme slides along the template.27 In this scheme, the bottom-most newly synthesized strand is not fully cross-linked and serves as the template for the next peptidoglycan layer. The experimental evidence supporting this mechanism is based on the failure of cell-wall-free (and hence template-free) spheroplasts and protoplasts to reform cell walls of the proper shape.28,29 Such a scheme is also consistent with the notion that transglycosylation and transpeptidation are tightly coordinated events in Gram-positive bacteria.30,31
We suggest that oritavancin-like glycopeptides can kill by interfering with template recognition during peptidoglycan biosynthesis. The key to interference with template recognition by oritavancin is the steric bulk of the disaccharide substituent. This is consistent with the improved antimicrobial activities observed for semi-synthetic glycopeptides alkylated with bulky hydrophobic substituents on their disaccharide moieties.21 Oritavancin can bind to either primary (D-Ala-D-Ala) or secondary (pentaglycyl segment) sites on the nascent peptidoglycan.19 By binding to the primary site, oritavancin sequesters Lipid II and inhibits transglycosylation just as vancomycin does. However, binding of oritavancin to the pentaglycyl bridging segment of a template strand within the peptidoglycan matrix could induce misalignment of adjacent stems which would interfere with cross-linking, as illustrated schematically in Figure 11.
Figure 11.

Template model of cell-wall biosynthesis of wild-type S. aureus. Peptidoglycan stems are shown in blue, pentaglycyl bridging segments in red, and cross-links in green. The orientation of the template strand (the last fully extended glycan chain) is recognized by a combined transglycosylase-transpeptidase (not shown). Addition of a nascent peptidoglycan strand at the membrane exoface is accompanied by partial cross-linking to the bridging segments of the template. (Some stems and bridging segments have been omitted from the figure for clarity.) Interference with template recognition and cross-linking by [19F]oritavancin results when the drug (purple) attaches to the template proximate to the nascent strand (middle site). Vancomycin bound at the same location does not block cross-linking because the required bulky fluorobiphenyl disaccharide substituent is missing. Both drugs block chain extension when bound to Lipid II (bottom site). The [19F]oritavancin that is bound between template and mature strands (top site) has the orientation shown in Figure 10 (left), and the 19F (green) to D-Ala 13C (yellow) distance of Figure 4 (left).
The model represented in Figure 11 provides an explanation to the seeming paradox that oritavancin analogues are often more potent than vancomycin against susceptible strains, yet have reduced binding affinities in solution for the tripeptide di-N-acetyl-L-Lys-D-Ala-D-Ala21,32 and other soluble peptidoglycan mimics.33 For oritavancin, structural interactions within the framework of the intact cell wall cannot be reproduced in solution. The drug is interacting with the heterogeneous, three-dimensional, insoluble peptidoglycan scaffold at the membrane surface and does more than bind to Lipid II. In addition, the efficacy of oritavancin against vancomycin-resistant strains with altered peptidoglycan stem termini (D-Ala-D-Lac) can be understood within this framework. The diminution in binding affinity to the D-Ala D-Lac stem terminus is compensated by binding to the pentaglycyl motif. This molecular-level description of the structure and function of oritavancin in S. aureus could drive the design of new vancomycin and oritavancin analogues that consider the interaction between the hydrophobic disaccharide substituent and the pentaglycyl bridging segment.
Materials and Methods
Growth and Labeling of S. aureus
Cells of S. aureus (ATCC 6538P) were grown in a defined medium as described before,18 and in the presence of the alanine racemase inhibitor, alaphosphin, when labeled with D-[1-13C]alanine.22 The cells were labeled by replacing an unlabeled amino acid of the medium by the corresponding labeled version. Typically, 1 L flasks with 300 mL labeling media were inoculated 1:250 with an overnight cell culture also grown in labeling media. Cells without added antibiotic were harvested during exponential growth at an OD660 0.4 by centrifugation at 10,000g for 10 min at 4 °C, washed twice with 5 mM HEPES (pH 7.0), and re-suspended in 5 mM HEPES/18 mM trehalose, frozen, and lyophilized. For the sample of Figure 7, [19F]oritavancin was added to drug-treated cells at OD660 0.2 to yield a concentration of 12 μg/mL, and cells were harvested 45 minutes later at an OD660 of ~0.3.13 For cells subjected to antibiotics in Figures 8 and 9, the drug was added at OD660 0.2 and the cells were harvested as above 90 minutes later. Vancomycin and oritavancin were added to yield final concentrations of 20 μg/mL. Penicillin was added to a final concentration of 0.15 μg/mL.
Synthesis of [19F]oritavancin and des-N-methylleucyl-[19F]oritavancin
4′-Fluorobiphenyl-4-carbaldehyde
To a solution of 1-bromo-4-fluorobenzene (1.25 mL, 11.4 mmol) in 1,2-dimethoxyethane (80 mL) was added tetrakis(triphenylphosphine)palladium (659 mg, 0.570 mmol). The mixture was stirred for 5 minutes and a solution of 4-formylphenylboronic acid (2.56 g, 17.1 mmol) in absolute ethanol (25 mL) was added followed by an aqueous solution of Cs2CO3 (11.4 mL, 2M, 22.8 mmol). The mixture was refluxed for 18h, filtered and concentrated. The crude mixture was diluted with CH2Cl2, washed with H2O (1×) and saturated aqueous NaCl solution (1×), dried over MgSO4, filtered and concentrated. Purification by flash chromatography on silica gel using a gradient of 0–20% EtOAc in hexanes provided 4′-fluorobiphenyl-4-carbaldehyde as a white solid (1.14 g, 50 % yield). 1H NMR (CDCl3, 400 MHz) δ 10.06 (s, 1H), 7.94–7.97 (m, 2H), 7.71 (d, J=8.2 Hz, 2H), 7.59–7.63 (m, 2H), 7.15–7.20 (m, 2H).
N-4-(4-fluorophenyl)benzyl chloroeremomycin ([19F]oritavancin)
To a suspension of chloroeremomycin acetate (443 mg, 0.250 mmol) in a mixture of DMF and methanol (2 mL and 12 mL) was added 4′-fluorobiphenyl-4-carbaldehyde (65 mg, 0.32 mmol). The reaction mixture was stirred for 2.5 h at 75 °C after which sodium cyanoborohydride (79 mg, 1.25 mmol) was added. Stirring was continued at 75 °C for an additional 2.5 h. The mixture was then cooled to room temperature and the crude product was precipitated upon addition of diethyl ether. The solids were filtered, washed with ether and dried under vacuum. The crude material was purified by reverse-phase C18 chromatography using a Biotage Horizon™ flash system. Elution was carried out with a gradient of 15–80% MeOH in aqueous Et3N/H3PO4 buffer (0.2% Et3N/H2O + H3PO4, pH = 3). The crude material was suspended in a mixture of MeOH and aqueous buffer and treated with 3.5 eq of 1N HCl to obtain a clear solution before purification. Pure fractions were combined, concentrated and lyophilized, then desalted by reverse-phase C18 chromatography, using a gradient of 15–80% MeCN in aqueous 0.1% HCO2H buffer. Pure fractions were combined, concentrated and lyophilized to provide [19F]oritavancin tris(hydrochloride) (123 mg, 26% yield). LCMS 98.2% (254 nm), 97.9% (220 nm), 98.0% (290 nm). MS: 1777.3 (M+H)+. Alternatively, desalting was completed on a reverse-phase C18 column, using a gradient of 15–80% 0.5% NH4OH/MeCN in 0.5% NH4OH/H2O. Pure fractions from this basic column were combined, concentrated and lyophilized to provide [19F]oritavancin as an ammonium salt in a similar yield. LCMS 98.9% (254 nm), 98.7% (220 nm), 98.9% (290 nm). MS: 1777.4 (M+H)+.
Des-N-methylleucyl N-4-(4-fluorophenyl)benzyl chloroeremomycin (Des N-methylleucyl [19F]oritavancin)
To [19F]oritavancin tris(hydrochloride) (160 mg, 0.085 mmol) in a 1:1 mixture of pyridine and H2O (8mL) was added phenylisothiocyanate (15 μL, 0.127 mmol). The reaction mixture was stirred for 1.5 h at room temperature and concentrated to dryness. The residue was suspended in CH2Cl2 at 0 °C and TFA (260 μL, 3.4 mmol) was added. The reaction mixture was stirred for 1 h 45 min at 0 °C then 4 h at room temperature, after which it was concentrated to dryness and purified by reverse-phase on a C18 column using the Biotage Horizon™ flash system. Product elution was accomplished with a gradient of 10–40% MeCN in 0.05% TFA/H2O. Pure fractions were combined, concentrated and lyophilized, then repurified on a second reverse-phase C18 column to remove TFA, using a gradient of 15–80% 0.5% NH4OH/MeCN in 0.5% NH4OH/H2O. Fractions from this second column were combined, concentrated and lyophilized to provide des N-methylleucyl [19F]oritavancin (54 mg, 38% yield). LCMS 98.4% (254 nm), 98.1% (220 nm), 97.7% (290 nm). MS: 1650.2 (M+H)+.
Antibiotic Activity
Minimum inhibitory concentrations for vancomycin and des-N-methylleucyl vancomycin were determined using S. aureus ATCC 29213;23 chloroeremomycin and its des-N-methylleucyl form using M. luteus ATCC 9341;7 and oritavancin, [19F]oritavancin, and their des-N-methylleucyl forms, using S. aureus ATCC 29213.
Dipolar Recoupling
REDOR was used to restore the dipolar coupling between heteronuclear pairs of spins that is removed by magic-angle spinning.20 REDOR experiments are always done in two parts, once with rotor-synchronized dephasing pulses (S) and once without (S0). The dephasing pulses change the sign of the heteronuclear dipolar coupling and this interferes with the spatial averaging resulting from the motion of the rotor. The difference in signal intensity (ΔS = S0 − S) for the observed spin in the two parts of the REDOR experiment is directly related to the distance to the dephasing spin.20
Solid-state NMR Spectrometers
The 13C{19F} and 15N{19F} REDOR experiments of Figures 4 and 5 were obtained using a 4-frequency transmission-line probe with a 17-mm long, 8.6-mm inside-diameter analytical coil and a Chemagnetics/Varian magic-angle spinning ceramic stator. Lyophilized cell-wall and whole-cell samples were spun in Chemagnetics/Varian 7.5-mm outside-diameter zirconia rotors at 5000 Hz with the speed under active control to within ±2 Hz. A 4.7-T static magnetic field was provided by an 89-mm bore Oxford superconducting solenoid. A Tecmag (Houston, TX) pulse programmer controlled the spectrometer. Radio frequency pulses for 13C and 15N were produced by 1-kW ENI (Andover, MA) LPI-10 power amplifiers. Radio frequency pulses for 1H (200 MHz) were produced by a 1-kW Kalmus Engineering Int. Ltd (Valencia, CA) power amplifier, and the 19F pulses by a 1-kW Dressler Hochfrequenztechnik Gmbh (Stolberg-Vicht, Germany) power amplifier. All four amplifiers were under active control.34 The π-pulse lengths were 10 μsec. Proton-carbon cross-polarization magic-angle spinning (CPMAS) transfers were made with radiofrequency fields of 50 kHz. Proton dipolar decoupling was 100 kHz. Standard XY-8 phase cycling35 was used for all pulses. The 15N chemical-shift scale was referenced relative to external ammonium sulfate.
The 15N REDOR full-echo spectra and 13C CPMAS spectra in Figure 7 were obtained using a 6-frequency transmission-line probe,36 having a 12-mm long, 6-mm inside-diameter analytical coil and a Chemagnetics/Varian magic-angle spinning ceramic stator. Lyophilized samples were spun in thin-wall Chemagnetics/Varian 5-mm outside-diameter zirconia rotors at 6250 Hz with the speed under active control to within ±2 Hz. A 12-T static magnetic field was provided by an 89-mm bore Magnex superconducting solenoid. The spectrometer was controlled by a Tecmag pulse programmer. Proton (500 MHz) radiofrequency pulses were generated by a 2-kW Amplifier Systems tube amplifiers driven by a 50-watt American Microwave Technology power amplifier. Radiofrequency pulses for 13C (125 MHz), and 15N (50.3 MHz) were produced by 2-kW American Microwave Technology power amplifiers. All amplifiers were under active control. The π-pulse lengths were 8 μsec for 13C and 9 μsec for 15N. Proton-carbon CPMAS transfers were made with radiofrequency fields of 62.5 kHz. Proton dipolar decoupling was 100 kHz with TPPM modulation37 during dipolar evolution and data acquisition.
REDOR NMR of the whole-cell samples of Figures 8 and 9 was performed using a 4-frequency transmission-line probe having a 14-mm long, 9-mm inside-diameter analytical coil, and a Chemagnetics/Varian stator and spinner housing. Lyophilized samples were spun using Chemagnetics/Varian 7.5-mm outside-diameter zirconia rotors at 5000 Hz with the speed under active control to within ±2 Hz. Experiments were done using a 7.05-Tesla magnet (300 MHz for protons). The spectrometer was controlled by a Chemagnetics console. Radiofrequency pulses were produced by 1-kW Kalmus, ENI, and American Microwave Technology power amplifiers under active control. The π-pulse lengths were 10 μsec for 15N and 13C. Proton-carbon cross-polarization transfers were made in 2 msec at 50 kHz. Proton dipolar decoupling was 100 kHz during data acquisition. The REDOR experiments of Figure 8 and Table 1 were each performed twice following confirmation of expected dephasing from a standard sample.
Acknowledgments
This paper is based on work supported by the National Institutes of Health under grant number EB002058. The authors would like to thank Ms. Ingrid Sarmiento and Dr. Francis F. Arhin for MIC measurements.
Abbreviations
- CPMAS
cross-polarization magic-angle spinning
- Lipid II
N-acetylglucosamine-N-acetyl-muramyl-pentapeptide-pyrophosphoryl-undecaprenol
- MIC
minimum inhibitory concentration
- REDOR
rotational-echo double resonance
- VRE
vancomycin-resistant enterococci
- VRSA
vancomycin-resistant Staphylococcus aureus.
Footnotes
Publisher's Disclaimer: This is a PDF file of an unedited manuscript that has been accepted for publication. As a service to our customers we are providing this early version of the manuscript. The manuscript will undergo copyediting, typesetting, and review of the resulting proof before it is published in its final citable form. Please note that during the production process errors may be discovered which could affect the content, and all legal disclaimers that apply to the journal pertain.
References
- 1.Hiramatsu K, Aritaka N, Hanaki H, Kawasaki S, Hosoda Y, Hori S, Fukuchi Y, Kobayashi I. Dissemination in Japanese hospitals of strains of Staphylococcus aureus heterogeneously resistant to vancomycin. Lancet. 1997;350:1670–3. doi: 10.1016/S0140-6736(97)07324-8. [DOI] [PubMed] [Google Scholar]
- 2.Johnson AP, Uttley AH, Woodford N, George RC. Resistance to vancomycin and teicoplanin: an emerging clinical problem. Clin Microbiol Rev. 1990;3:280–91. doi: 10.1128/cmr.3.3.280. [DOI] [PMC free article] [PubMed] [Google Scholar]
- 3.CDC. Staphylococcus aureus resistant to vancomycin-United States, 2002. Morb Mortal Wkly Rep. 2002;51:565–7. [PubMed] [Google Scholar]
- 4.Noble WC, Virani Z, Cree RG. Co-transfer of vancomycin and other resistance genes from Enterococcus faecalis NCTC 12201 to Staphylococcus aureus. FEMS Microbiol Lett. 1992;72:195–8. doi: 10.1016/0378-1097(92)90528-v. [DOI] [PubMed] [Google Scholar]
- 5.Van Bambeke F. Glycopeptides in clinical development: pharmacological profile and clinical perspectives. Curr Opin Pharmacol. 2004;4:471–8. doi: 10.1016/j.coph.2004.04.006. [DOI] [PubMed] [Google Scholar]
- 6.Barrett JF. Oritavancin. Eli Lilly & Co. Curr Opin Investig Drugs. 2001;2:1039–44. [PubMed] [Google Scholar]
- 7.Allen NE, Nicas TI. Mechanism of action of oritavancin and related glycopeptide antibiotics. FEMS Microbiol Rev. 2003;26:511–32. doi: 10.1111/j.1574-6976.2003.tb00628.x. [DOI] [PubMed] [Google Scholar]
- 8.Reynolds PE, Somner EA. Comparison of the target sites and mechanisms of action of glycopeptide and lipoglycodepsipeptide antibiotics. Drug Exp Clin Res. 1990;16:385–9. [PubMed] [Google Scholar]
- 9.Molitor E, Kluczny C, Brotz H, Bierbaum G, Jack R, Sahl HG. Effects of the lantibiotic mersacidin on the morphology of staphylococci. Zentralbl Bakteriol. 1996;284:318–28. doi: 10.1016/s0934-8840(96)80108-3. [DOI] [PubMed] [Google Scholar]
- 10.Perkins HR. Specificity of combination between mucopeptide precursors and vancomycin or ristocetin. Biochem J. 1969;111:195–205. doi: 10.1042/bj1110195. [DOI] [PMC free article] [PubMed] [Google Scholar]
- 11.Reynolds P. Studies on the mode of action of vancomycin. Biochim Biophys Acta. 1961;52:403. doi: 10.1016/0006-3002(61)90698-9. [DOI] [PubMed] [Google Scholar]
- 12.Matsuhashi S, Strominger JL. Isolation of thymidine diphosphate D-glucose, thymidine diphosphate D-galactose, and thymidine diphosphate 4-acetamido-4, 6-dideoxy-D-galactose from Pasteurella pseudotuberculosis. J Bacteriol. 1967;93:2017–2019. doi: 10.1128/jb.93.6.2017-2019.1967. [DOI] [PMC free article] [PubMed] [Google Scholar]
- 13.Cegelski L, Kim SJ, Hing AW, Studelska DR, O’Connor RD, Mehta AK, Schaefer J. Rotational-echo double resonance characterization of the effects of vancomycin on cell wall synthesis in Staphylococcus aureus. Biochemistry. 2002;41:13053–13058. doi: 10.1021/bi0202326. [DOI] [PubMed] [Google Scholar]
- 14.Tipper DJ, Strominger JL. Mechanism of action of penicillins: a proposal based on their structural similarity to acyl-D-alanyl-D-alanine. Proc Natl Acad Sci U S A. 1965;54:1133–41. doi: 10.1073/pnas.54.4.1133. [DOI] [PMC free article] [PubMed] [Google Scholar]
- 15.Anderson JS, Matsuhashi M, Haskin MA, Strominger JL. Biosythesis of the peptidoglycan of bacterial cell walls. II Phospholipid carriers in the reaction sequence. J Biol Chem. 1967;242:3180–90. [PubMed] [Google Scholar]
- 16.Matsuhashi M, Dietrich CP, Strominger JL. Incorporation of glycine into the cell wall glycopeptide in Staphylococcus aureus: role of sRNA and lipid intermediates. Proc Natl Acad Sci U S A. 1965;54:587–94. doi: 10.1073/pnas.54.2.587. [DOI] [PMC free article] [PubMed] [Google Scholar]
- 17.Beauregard DA, Williams DH, Gwynn MN, Knowles DJ. Dimerization and membrane anchors in extracellular targeting of vancomycin group antibiotics. Antimicrob Agents Chemother. 1995;39:781–5. doi: 10.1128/AAC.39.3.781. [DOI] [PMC free article] [PubMed] [Google Scholar]
- 18.Kim SJ, Cegelski L, Studelska DR, O’Connor RD, Mehta AK, Schaefer J. Rotational-echo double resonance characterization of vancomycin binding sites in Staphylococcus aureus. Biochemistry. 2002;41:6967–6977. doi: 10.1021/bi0121407. [DOI] [PubMed] [Google Scholar]
- 19.Kim SJ, Cegelski L, Preobrazhenskaya M, Schaefer J. Structures of Staphylococcus aureus cell-wall complexes with vancomycin, eremomycin, and chloroeremomycin derivatives by 13C{19F} and 15N{19F} rotational-echo double resonance. Biochemistry. 2006;45:5235–50. doi: 10.1021/bi052660s. [DOI] [PMC free article] [PubMed] [Google Scholar]
- 20.Gullion T, Schaefer J. Detection of Weak Heteronuclear Dipolar Coupling by Rotational-Echo Double-Resonance Nuclear Magnetic Resonance. Adv Magn Reson. 1989;13:57–83. [Google Scholar]
- 21.Allen NE, LeTourneau DL, Hobbs JN., Jr The role of hydrophobic side chains as determinants of antibacterial activity of semisynthetic glycopeptide antibiotics. J Antibiot. 1997;50:677–684. doi: 10.7164/antibiotics.50.677. [DOI] [PubMed] [Google Scholar]
- 22.Cegelski L, Steuber D, Mehta AK, Kulp DW, Axelsen PH, Schaefer J. Conformational and quantitative characterization of oritavancin-peptidoglycan complexes in whole cells of Staphylococcus aureus by in vivo 13C and 15N labeling. J Mol Biol. 2006;357:1253–62. doi: 10.1016/j.jmb.2006.01.040. [DOI] [PubMed] [Google Scholar]
- 23.Goldman RC, Baizman ER, Longley CB, Branstrom AA. Chlorobiphenyl-desleucyl-vancomycin inhibits the transglycosylation process required for peptidoglycan synthesis in bacteria in the absence of dipeptide binding. FEMS Microbiol Lett. 2000;183:209–214. doi: 10.1111/j.1574-6968.2000.tb08959.x. [DOI] [PubMed] [Google Scholar]
- 24.Tong G, Pan Y, Dong H, Pryor R, Wilson GE, Schaefer J. Structure and dynamics of pentaglycyl bridges in the cell walls of Staphylococcus aureus by 13C-15N REDOR NMR. Biochemistry. 1997;36:9859–9866. doi: 10.1021/bi970495d. [DOI] [PubMed] [Google Scholar]
- 25.Giesbrecht P, Kersten T, Maidhof H, Wecke J. Staphylococcal cell wall: morphogenesis and fatal variations in the presence of penicillin. Microbiol Mol Biol Rev. 1998;62:1371–414. doi: 10.1128/mmbr.62.4.1371-1414.1998. [DOI] [PMC free article] [PubMed] [Google Scholar]
- 26.Leimkuhler C, Chen L, Barrett D, Panzone G, Sun B, Falcone B, Oberthur M, Donadio S, Walker S, Kahne D. Differential inhibition of Staphylococcus aureus PBP2 by glycopeptide antibiotics. J Am Chem Soc. 2005;127:3250–1. doi: 10.1021/ja043849e. [DOI] [PubMed] [Google Scholar]
- 27.Höltje JV. Growth of the stress-bearing and shape-maintaining murein sacculus of Escherichia coli. Microbiol Mol Biol Rev. 1998;62:181–203. doi: 10.1128/mmbr.62.1.181-203.1998. [DOI] [PMC free article] [PubMed] [Google Scholar]
- 28.Ghuysen JM. Use of bacteriolytic enzymes in determination of wall structure and their role in cell metabolism. Bacteriol Rev. 1968;32(Suppl):425–464. [PMC free article] [PubMed] [Google Scholar]
- 29.Schwarz U, Leutgeb W. Morphogenetic aspects of murein structure and biosynthesis. J Bacteriol. 1971;106:588–595. doi: 10.1128/jb.106.2.588-595.1971. [DOI] [PMC free article] [PubMed] [Google Scholar]
- 30.van Heijenoort J. Recent advances in the formation of the bacterial peptidoglycan monomer unit. Nat Prod Rep. 2001;18:503–519. doi: 10.1039/a804532a. [DOI] [PubMed] [Google Scholar]
- 31.Boneca IG, Huang ZH, Gage DA, Tomasz A. Characterization of Staphylococcus aureus cell wall glycan strands, evidence for a new beta-N-acetylglucosaminidase activity. J Biol Chem. 2000;275:9910–9918. doi: 10.1074/jbc.275.14.9910. [DOI] [PubMed] [Google Scholar]
- 32.Good VM, Gwynn MN, Knowles DJ. MM 45289, a potent glycopeptide antibiotic which interacts weakly with diacetyl-L-lysyl-D-alanyl-D-alanine. J Antibiot. 1990;43:550–5. doi: 10.7164/antibiotics.43.550. [DOI] [PubMed] [Google Scholar]
- 33.Vollmerhaus PJ, Breukink E, Heck AJ. Getting closer to the real bacterial cell wall target: biomolecular interactions of water-soluble lipid II with glycopeptide antibiotics. Chem Eur J. 2003;9:1556–1565. doi: 10.1002/chem.200390179. [DOI] [PubMed] [Google Scholar]
- 34.Stueber D, Mehta AK, Chen Z, Wooley KL, Schaefer J. Local order in polycarbonate plasses by 13C{19F} Rotational-Echo Double-Resonance NMR. J Polym Sci, Part B: Polym Phys. 2006;44:2760–2775. [Google Scholar]
- 35.Gullion T, Baker DB, Conradi MS. New, compensated Carr-Purcell sequences. J Magn Reson. 1990;89:479–484. [Google Scholar]
- 36.Schaefer J, McKay RA. Multi-tuned single coil transmission line probe for nuclear magnetic resonance spectrometer. 5,861,748 US Patent. 1999
- 37.Bennett AE, Reienstra CM, Auger M, Lakshmi KV, Griffin RG. Heteronuclear decoupling in rotating solids. J Chem Phys. 1995;103:6951–6958. [Google Scholar]