


Figure 3.
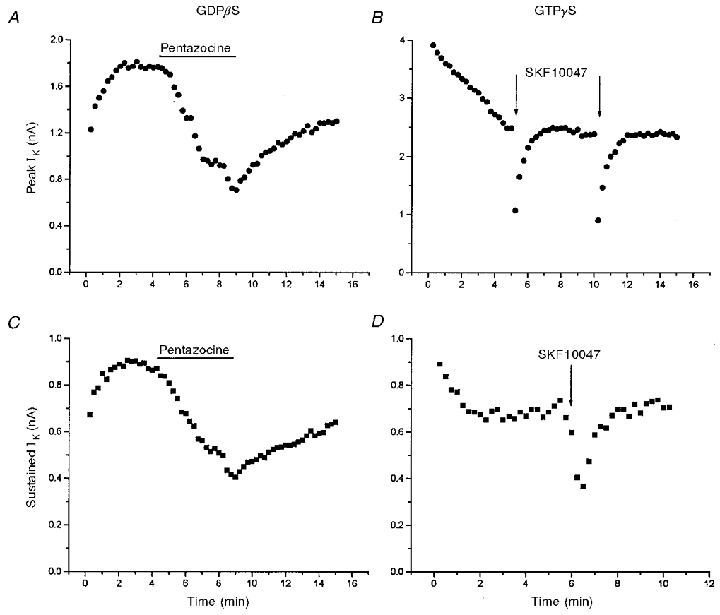
IK modulation and G-protein perturbation
Pentazocine (100 μm) reversibly reduced both peak (A) and sustained (C) IK in a nerve terminal perfused with 1 mM GDPβS (IK evoked by 250 ms pulses from -100 to 50 mV). SKF10047 (100 μm) reversibly inhibited both peak (B) and sustained (D) IK in a nerve terminal filled with 100 μm GTPγS (IK evoked by 250 ms pulses from -80 to 10 mV). In A and C, pentazocine was added to the bathing solution; both plots are taken from the same recording. In B and D, SKF10047 was applied by pressure ejection of an ≈2 μm diameter-tipped micropipette positioned within 10 μm of the nerve terminal under recording; the plots are from different recordings. The different time courses of inhibition and recovery reflect the different modes of drug application. GDPβS and GTPγS began to perfuse the cell interior at break-in, shortly before data acquisition was started. The increase (A and C) in IK at the beginning of the experiment with GDPβS (prior to drug application) results from block of G-protein-dependent modulation of channels. The decrease (B and D) in IK at the beginning of the experiment with GTPγS results from the enhancement of this modulation (Bielefeldt & Jackson, 1994).