


Figure 3.
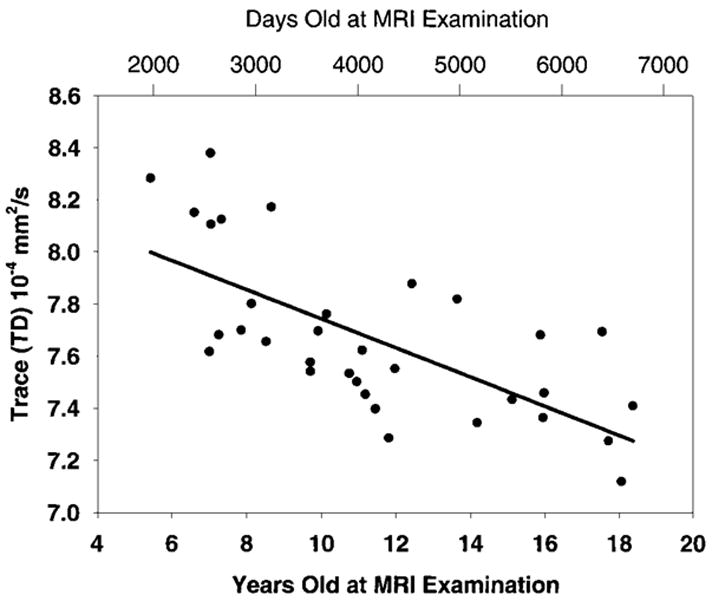
Scatterplot shows correlation of the trace of the apparent diffusion coefficient with age. The Spearman rank correlation coefficient, R, was −0.68, and the P value was less than .001 for all pixels having a significant correlation in the sixth section (middle row, second image from left) of Figure 1.