


Figure 2.
Array-CGH and FISH Findings among Patients and Their Parents
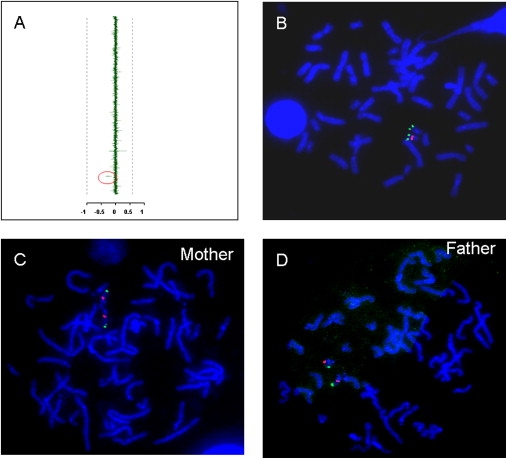
(A) Representative array-CGH output. The mean normalized log2(Cy3/Cy5) ratio of each BAC is plotted on the x axis as dots with error bars and arranged along the vertical axis from chromosome 1 at the top to chromosomes X and Y at the bottom. Decreased copy number was identified for two BAC clones, RP11-36N5 and 296H20 (marked by a red ellipse to the left of the vertical axis), which map between LCR22-4 and LCR22-5 on chromosome 22q11.2, just distal to the telomeric end of the common DGS/VCFS ∼3 Mb deletion.
(B) Representative FISH analysis of deletion case. The two red fluorescence signals represent hybridization using a subtelomeric chromosome 22q FISH probe, and the single green signal represents the hybridization of the RP11-36N5 clone to the normal (nondeleted) chromosome 22. Deletions were confirmed by FISH analyses in all the cases.
(C and D) Representative FISH analyses of normal parents. Metaphase FISH analysis using the same probes detected two normal copies of the distal 22q11.2 probe among the parents.