


Abstract
Recent experimental advances in producing density maps from cryo-electron microscopy (cryo-EM) have challenged theorists to develop improved techniques to provide structural models that are consistent with the data and that preserve all the local stereochemistry associated with the biomolecule. We develop a new technique that maintains the local geometry and chemistry at each stage of the fitting procedure. A geometric simulation is used to drive the structure from some appropriate starting point (a nearby experimental structure or a modeled structure) toward the experimental density, via a set of small incremental motions. Structural motifs such as α-helices can be held rigid during the fitting procedure as the starting structure is brought into alignment with the experimental density. After validating this procedure on simulated data for adenylate kinase and lactoferrin, we show how cryo-EM data for two different GroEL structures can be fit using a starting x-ray crystal structure. We show that by incorporating the correct local stereochemistry in the modeling, structures can be obtained with effective resolution that is significantly higher than might be expected from the nominal cryo-EM resolution.
Introduction
In recent years, cryo-electron microscopy (cryo-EM) has emerged as an important source of structural information on biomolecular systems. Although the spatial information available through cryo-EM is typically at a lower resolution than that available through x-ray crystallography, cryo-EM excels in its ability to describe the structural heterogeneity of a sample and in its ability to image large biomolecular complexes that are often resistant to crystallization.
The usage of cryo-EM and x-ray crystallography as complementary methods has been assisted by computational methods for fitting an x-ray structure with atomic detail into a three-dimensional map obtained through cryo-EM. This is especially important in cases in which cryo-EM has been used to image large macromolecular complexes whose individual components have been characterized using x-ray crystallography, or in which there is a significant difference between the conformational states of a molecule that have been characterized by the two methods. Because this fitting process uses information from high-resolution structures, it is possible to obtain “pseudo-atomic resolution” models with higher effective resolution than the nominal resolution of the cryo-EM map (1–3).
When conformational changes play a role, flexible fitting tools are essential for a molecular-level understanding of these conformational changes and their possible biological relevance. Flexible fitting has been carried out using molecular simulation methods such as molecular dynamics (3–6) and elastic network modeling (ENM) (7–10) with generally good results. Both these methods have proved to be successful, but have their drawbacks. Molecular dynamics has very high complexity and computational cost, whereas elastic network modeling can sometimes introduce nonphysical distortions of the structure and introduce steric clashes that must be resolved through postfitting minimization. An important recent review of the relative strengths of several popular flexible fitting methods (3) emphasizes that this field currently lacks a “gold standard” to which new methods should be compared, in part because the criteria according to which fitted structures should be judged are themselves debatable. Uncertainty exists as to the relative importance of stereochemical quality, fit optimality, and calculation speed, as well as the details of how each of these should be quantified in the first place.
A distinction should be made with regards to terminology: x-ray crystallography determines the electron density of a sample, whereas electron microscopy measures the Coulomb potential distribution (11,12). Although these two density distributions are not equivalent, they are similar in the resolution range relevant for biological cryo-EM (5,13) and maps generated with cryo-EM are referred to commonly as “electron density maps” in the literature (7, 8,14,17–19). It is the electron density that is the focus of the fitting procedures developed in this article, as is common to other approaches (3). In the following discussion, the term “density map” will be used.
We develop a novel method for the flexible fitting of high-resolution structures to cryo-EM maps using constrained geometric simulations (20) as implemented in the FIRST/FRODA software package (available at http://flexweb.asu.edu). These simulations have the distinct advantage that rigid units (such as secondary structure elements) are identified in the starting structure based on physical principles and maintained intact throughout the simulation. This ensures that the local geometry and stereochemistry are valid and maintained at every point during the simulation. No nonphysical distortions of the structure take place.
In some ways, this method has important similarities to the rotation-translation block method of Tama et al. (21), in which the effective number of degrees of freedom in an ENM calculation is reduced by breaking the protein into rigid units of a few consecutive amino acids. The constrained geometric approach, however, has the distinct advantage that rigid units are identified on physical grounds rather than being chosen arbitrarily. This rigid-cluster-based dynamics is one important advantage of the method presented here, and combinations of rigid cluster decomposition using FIRST with molecular dynamics or ENM methods may prove fruitful in the future (22).
We have used constrained geometric simulations to flexibly fit high-resolution x-ray structures to theoretically-generated density maps both with and without noise. In addition, we have used this flexible fitting method to fit an x-ray crystal structure of the bacterial chaperonin GroEL to two different cryo-EM maps, allowing the conformational changes involved in GroEL function to be investigated.
We have found that constrained geometric simulations are able to flexibly fit x-ray structures into both theoretically-generated and experimental density maps with atomic detail and a high level of accuracy. Although the amount of information contained in a cryo-EM map is far more limited than that contained in an x-ray crystallographic map, the low-resolution data provides powerful constraints on the large-scale arrangement of structural elements, which in turn depend on the detailed local packing when correct local stereochemistry is incorporated into the model. When this is combined with constraints based on the identification of rigid regions in the protein, the overall result is that only a relatively small region of conformational space is consistent with both the global constraints provided by the cryo-EM data and the local constraints enforced by geometric simulations. This region of conformational space can be found by maximizing the real-space correlation coefficient between the target map and a density that is calculated based on the moving structure, while moving the structure in a way consistent with the local geometric constraints–see Methods for more details. This method allows us to identify conformations consistent with both sets of constraints and therefore to get a good sense of the atomic-level structure that underlies the cryo-EM data.
Materials and methods
Constrained geometric simulations
Our multi-scale flexible fitting tool is based on the recently-developed constrained geometric simulation algorithm FRODA (Framework Rigidity Optimized Dynamical Algorithm) (20), which is implemented as a module of the FIRST (Floppy Inclusion and Rigid Substructure Topography) software package. FRODA is a Monte Carlo-type algorithm in which diffusive motion in biomolecules is simulated as motion of rigid clusters within the biomolecule by rotation about bonds, and steric clashes are avoided. In short, FRODA models a biomolecular structure as a collection of atoms, each of which belongs to one or more rigid “ghosts” that serve to guide the motion of the atoms. At each step, the atoms are thrown from their ghosts by ∼0.1 Å, and the atoms and ghosts are iteratively re-fit to one another until a new valid conformation is found. A more detailed description of the FRODA method can be found in the Supplementary Material accompanying this article or in Wells et al (20). The rigid clusters are identified using FIRST, which identifies rigid and flexible regions in the structure using a graph-theoretical algorithm known as the pebble game. A detailed description of FIRST and the pebble game approach can be found in (23–28).
In this study, the direction of the atomic throws (and therefore of all subsequent motion) was random, being guided only by the rigid ghosts and by changes in the scoring function. The throw directions could also be chosen in a nonrandom way, such as movement along an elastic normal mode or bias toward a particular target structure.
Scoring
To use FRODA to fit an atomic structure to a density map, a constrained Monte Carlo simulation is used to maximize the real-space correlation coefficient
which quantifies the degree of overlap between the experimental density ρexp and the simulated density ρsim. This avoids having to normalize the intensity of the experimental density. The correlation coefficient ranges from 0 (no overlap) to 1 (perfect overlap). At each step in the simulation, ρsim is calculated based on the current FRODA conformer, and the correlation coefficient is evaluated. The decision to keep or reject the new conformer is made based on the Metropolis criterion (29), with the correlation coefficient playing a role analogous to the energy in a standard Metropolis simulation. In other words, a random move that improves the correlation between ρexp and ρsim (i.e., ΔC > 0) will always be accepted, and a random move that decreases the correlation (ΔC < 0) will be accepted with a probability of eΔC/s, where the annealing scale s plays a role similar to that played by the thermal energy kT in the usual Metropolis algorithm, and for simplicity we will refer to s as a temperature. To avoid having to carefully select an appropriate value of s, we used a dynamic temperature adjustment scheme that adjusts the value of s during the course of a simulation to maintain a desired acceptance rate, usually 50%.
Generating density maps
To calculate a simulated density map based on a high-resolution structure, we start with scattering factors that were calculated for naturally-occurring elements using a multiconfiguration Dirac-Fock code (30), and conveniently expressed as a sum of a few Gaussians. Electron densities for individual atoms were obtained from the scattering factors using three-dimensional Fourier transforms (Fig. 1), and the densities of each individual atom in a high-resolution structure were summed to create molecular density maps.
Figure 1.
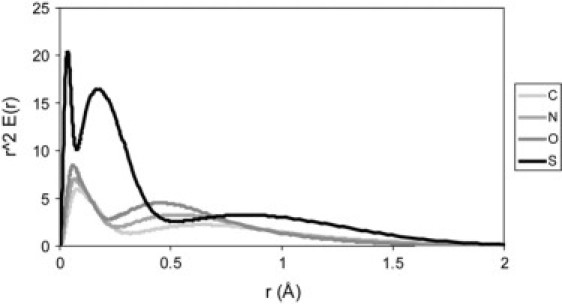
Atomic electron densities used to generate simulated cryo-EM data. The calculated electron densities for carbon, nitrogen, oxygen, and sulfur are shown. These are the “zero-resolution” densities; simulated finite-resolution data is obtained by convolving each of these with a Gaussian function.
Simulating experimental data
To make these density maps more similar to those obtained experimentally, we convolved this ideal map with a Gaussian function, yielding noise-free maps at finite resolution. To obtain physically-relevant values for the resolution, we fitted a three-dimensional Gaussian to the function obtained by starting with a single real-space δ-function (corresponding to a constant in k-space) that is Fourier-transformed back into real space, neglecting any contribution from k > kmax. The width of the resulting real-space peak was used to set up a direct correspondence between the resolution obtained in a diffraction experiment (2π/kmax) and the width σ of the Gaussian used for convolution. This procedure yields results that look qualitatively similar to experimental electron density maps at a given resolution. The choice of a Gaussian kernel for the broadening of the density map was not inevitable; other tools for the generation of density maps from crystal structure coordinates allow for the usage of a variety of kernels (31). The Gaussian kernel was chosen primarily because of the fact that the approximate scattering factors (30) were expressed in terms of a sum of Gaussians, which made Gaussian convolution particularly convenient. Other more complex schemes could also be incorporated into this method.
The presence of noise in experimental data is inevitable, and can provide serious limitations to the accuracy of flexible fitting methods. To assess the ability of this method to cope with noisy data, we also generated theoretical density maps with a controllable amount of noise. If the density measured in a particular voxel is N, then we assumed that the noise level in that voxel will be proportional to the square root of N. More precisely, the noise was modeled using a Gaussian distribution with σ proportional to the square root of N; the constant of proportionality can be varied to control the amount of noise present in the simulated data, and an overall signal/noise ratio can be calculated after the noisy map has been created.
Structure preparation
Simulations with FIRST/FRODA require that hydrogen atoms be present in the structure. Hydrogen atoms were not present in any of the structures obtained from the PDB (Protein Data Bank, http://www.pdb.org), and were added using Reduce (available at http://kinemage.duke.edu) (32). FIRST/FRODA imposes rather stringent requirements for stereochemical quality, and the crystal structure for GroEL (PDB accession code 1KP8) contained some steric clashes that prevented FRODA from starting successfully. To resolve these clashes, we subjected the GroEL structure to a conjugate gradient minimization using the CHARMM force field in the molecular dynamics package NAMD2 (33). To avoid any large-scale changes during the minimization, each atom was tethered to its initial position by a harmonic restraint with spring constant k = 5.0 kcal/mol/Å2.
Simulation details
The apo-GroEL simulation was run with a resolution of 10.3 Å in three separate phases. In the first phase, every individual rigid body was thrown in FRODA, allowing for optimal sampling of large-scale, collective motions. In each step of the second and third phases, each rigid body was thrown with a probability of 0.1 and 0.01, respectively, whereas those rigid bodies not being moved actively made only minor adjustments in response to the movement of their neighbors. This allowed us to sample localized motions more effectively in the later stages of the fitting, as required for an optimal fit. The ATP-bound GroEL simulations were run at a resolution of 14.9 Å, using the same three-step scheme to decrease throw probability. Because these simulations involved larger motions and therefore a potentially greater computational cost, we increased the simulation speed by increasing the spacing of the map grid during the first two phases. The original cryo-EM data was on a grid with a spacing of ∼1.9 Å; by ignoring every other point we could increase the spacing to ∼3.7 Å and decrease the information content of the map by 1/8, resulting in a significant speedup. This speedup, of course, comes at the cost of a lowered signal/noise ratio; for this reason the full grid was used during the final phase of the simulation. Each simulation phase was stopped when the correlation score stopped improving. A fourth simulation phase (in which the throw probability would have been further decreased) was not used because the improvement between the second and third phases was small. A similar sort of procedure could be applied for other systems, but will probably be most effective in large structures with many separate rigid clusters.
Results and discussion
Resolution and grid spacing
As a first test case, we selected adenylate kinase (ADK). X-ray structures of ADK have been solved in both its closed form (PDB accession code 1AKE) and its open form (PDB code 4AKE). The root mean-square difference between these two structures is relatively large (∼7.2 Å) and yet the system is small enough (214 residues) to allow for fast computations. Most of the conformational change between the open and closed forms involves motion about a hinge domain (Fig. 2 A) and the improved fit to the density map can clearly be seen.
Figure 2.

(A) Fitting of ADK into a theoretical density map with 4 Å resolution. The map was generated using the open form of ADK (PDB ID 4AKE), and the image on the left shows the best rigid fit (using FRODA) between this map and the closed form of ADK (PDB ID 1AKE). The image on the right shows the result of flexible fitting. (B) Fitting of lactoferrin into a theoretic map with 5 Å resolution. The map was generated using the open form of lactoferrin (PDB ID 1LFH), and the simulation was started from the closed form (PDB ID 1LFG). (C) Fitting of GroEL into an experimental map at 14.9 Å resolution. The images shown are from the intact domain fitting (see text for details). The Supplementary Material accompanying this article contains animated versions of these trajectories.
In any constrained geometric simulation using FIRST/FRODA, the choice of the noncovalent constraint network is crucial (34). If too many noncovalent constraints are included, the protein will be overly rigid and flexible fitting will become impossible. If too few are included, the protein will be overly flexible and the geometric integrity of secondary structure elements will be lost, eliminating some of the advantages of the constrained geometric approach. In general, however, including fewer constraints leads to a higher final value of the correlation coefficient, so that the choice of the noncovalent network involves a compromise between detailed fitting and chemical integrity. In this case, we have chosen a noncovalent constraint network that maintains most of the α-helices in ADK as rigid units, whereas most of the random coil regions remain flexible. Based on a direct all-atom targeting (20) using this constraint network, the closed conformation should be able to come within about RMSD ∼1 Å of the open structure without violating any of the noncovalent constraints included.
This method requires comparison of the target density map with a simulated map calculated based on the moving structure. This map is calculated by placing calculated electron densities on each nonhydrogen atom in the structure, adding them together, and using Gaussian convolution to broaden the map to an arbitrary resolution. To test the effects of resolution on flexible fitting, we have fitted the closed form of ADK to density maps generated using the open form, with the resolution ranging from 0 to 13.3 Å in 0.67-Å steps. The fitting in the opposite direction, starting from the open crystal structure and fitting to the closed form, was also tested and works equally well. The correlation function is evaluated on a regular cubic grid, with the choice of grid spacing reflecting a balance between speed (favored by a large grid spacing) and accuracy (favored by a small grid spacing). For each resolution, we repeated the calculation with 1, 2, 3, and 4 Å grid spacings. For the fitting at each resolution and grid spacing, we measured the improvement of the correlation during the course of the simulation, as well as the root mean-square deviation (RMSD) from the open form of ADK. The RMSD-to-target is a particularly important measure, because it indicates how well the targeting routines are able to reproduce the “real” structure behind a low-resolution map. This sort of validation is only possible for theoretically-generated data.
The results show that, for nonpathological cases, a roughly linear relationship can be established between the accuracy of fitting and the resolution of the density map. For most simulations, the RMSD and the correlation score roughly track one another, and each reaches an asymptotic value eventually (Fig. 3). The asymptotic value of the RMSD will tend to be higher for lower-resolution maps, and lower for high-resolution maps. This result is what we would expect intuitively. Higher-resolution maps have higher information content and are able to constrain more effectively the final fitted structure (Fig. 4).
Figure 3.

Plots of the real-space correlation (top) and all-atom RMSD (bottom) for results of ADK fitting with resolutions from 0–13.3 Å using a 1 Å grid. Some curves have been omitted for visual clarity. Note that the curves for both the correlation and the RMSD reach a steady asymptotic value at the same point, around conformer 30,000. The RMSD plot shows that the fitting for resolutions >2.0 Å was successful, whereas the higher-resolution simulations generally failed to converge. The 0 Å simulation shows a lack of any clear convergence; the spiky appearance of the 0 Å correlation plot results from high noise sensitivity at small values of the correlation. Complete plots for 1–4 Å grids are contained in the Supplementary Material accompanying this article.
Figure 4.

The relationship between resolution and fit quality (measured by the minimum RMSD between the simulated and target structures) for ADK and lactoferrin. Notice that the fit quality deteriorates rapidly as the grid spacing approaches the resolution length scale, and that the choice of grid spacing seems to be unimportant as long as it is smaller than the length scale imposed by resolution. For grid spacings that gave an acceptable fit, there is a roughly linear relationship in which fit quality improves with resolution.
Another important result concerns those cases in which successful fitting cannot be carried out. The linear behavior described above breaks down when we attempt to fit a map with a resolution that is comparable to the grid spacing. In these cases, the simulations do not converge, and the simulated structure does not move toward its target. Below this threshold, however, the choice of grid spacing seems to be of little importance. We can therefore obtain optimal fitting performance by choosing a grid spacing that is somewhat smaller than the length scale imposed by the cryo-EM resolution.
The same set of trial simulations was conducted using lactoferrin (Fig. 2 B). Lactoferrin is somewhat larger than ADK, with 691 residues, and undergoes a conformational change of ∼6.5 Å. Plots of the all-atom RMSD and correlation are contained in the Supplementary Material accompanying this article. The results obtained with lactoferrin were qualitatively similar to those with ADK, with the fitting process failing as the grid spacing approaches the resolution length scale. This fitting method should therefore be used with caution on maps in this resolution range. The difficulty is associated with the highly structured density at resolutions <5 Å, where the density is significantly higher at the center of each atom. This leads to a “corrugation” effect in which it is difficult for the trial density to glide over the target density. At resolutions greater than ∼5 Å (the relevant region for cryo-EM), the density is much smoother and the problem disappears.
Noise tolerance
To effectively fit atomic models to real cryo-EM data, it is essential that the method be able to tolerate noise in the map. To evaluate the robustness of the fitting algorithm in the presence of noise, we have used theoretical density maps to which noise had been added, as described in Materials and Methods. ADK was fit at 3.3 Å resolution with signal/noise (S/N) ratios ranging from 10 to 1 (Fig. 5). High levels of noise were detrimental to both the speed and accuracy of fitting, but modest noise levels (S/N > 1) seemed to have very little impact on the fitting results. This gives some confidence that this method is robust enough to withstand reasonable amounts of experimental noise.
Figure 5.

The effects of noise on ADK fitting at 3.3 Å resolution. The simulations converged for all levels of noise considered, although the quality of the fit was diminished for extremely high levels of signal/noise (S/N = 1). The results seem to be nearly identical for signal/noise ratios >1, indicating that this flexible fitting method is robust in the presence of relatively high levels of noise.
Effects of missing density
Another potential issue that could arise when working with experimental cryo-EM maps is that regions of density may be missing in the experimental data. To test the effects of missing density on our fitting method, we constructed a map at 6.6 Å using the open form of ADK, except that the C-terminal helix had been removed (Fig. 6). We then attempted to fit the complete closed form of ADK into this partial map. The result was that, rather than dangling outside, the C-terminal helix was pressed into the density, distorting the surrounding region and forcing some other secondary structure elements slightly out of the way. This result could have been anticipated and is what we would expect intuitively. This also underscores the importance of knowing what is present in an experimental ED map before attempting flexible fitting. If some portions of the structure are missing, the resulting fit could be seriously distorted. One possible way to avoid this problem would be to choose parameters that give larger rigid clusters, effectively decreasing the number of degrees of freedom and avoiding internal distortions. ADK has a high degree of intrinsic flexibility, however, and drastic limitation of the degrees of freedom would be physically unmotivated.
Figure 6.

Effects of missing density on ADK fitting at 8.0 Å resolution. (Left) Results of fitting the closed structure of ADK (Fig. 1) to a map generated using the complete open structure of ADK. (Right) Before the map was generated, the C-terminal helix (indicated with a red arrow) was deleted, resulting in missing density, marked with a dotted line in the image on the right. When the complete closed form of ADK was fit into this incomplete map, the “extra” C-terminal helix was pushed upward into the density, resulting in some distortion of the surrounding region. Regions of the structure relatively distant from the modification are largely unchanged.
If concerns exist that the structure being used for fitting may contain more (or fewer) atoms than the molecule used to generate the density map, one appropriate solution might be to subtract a map generated based on the final fitted structure from the target map. Such a difference map would show significant density only in those areas where local errors existed in the fit. The structures shown in Fig. 6 suggest that errors introduced by missing density will be localized around the faulty region in the density map, so a large amplitude in the difference map could point to problem areas in the density map or the atomic model. It should also be emphasized that these difficulties do not nullify one of the major advantages of real-space fitting (3), which is that single members of a multi-component complex can be fitted into a map of the complete complex even if their neighbors are missing.
Fitting experimental density
To test the ability of our method to work with experimental cryo-EM data, we studied a conformational transition in the bacterial chaperonin GroEL. GroEL is a multimeric complex formed from two heptameric rings, with a total of 7350 residues. Each GroEL monomer can be divided into three domains (35), the equatorial domain (residues 1–133 and 409–526), which forms strong contacts with monomers in the opposite ring, an intermediate domain (residues 134–190 and 377–408), and an apical domain (residues 191–376) that interacts with the co-chaperonin GroES. Misfolded or unfolded proteins bind nonspecifically to the hydrophobic interior of unliganded GroEL. On binding ATP, GroEL undergoes a conformational change that enables binding to GroES. This traps the misfolded substrate protein in an environment more conducive to proper folding; for a recent review of GroEL function see Lin and Rye (36).
GroEL has been the subject of numerous structural studies using both x-ray crystallography and cryo-EM. We have used a 2.0 Å crystal structure (37) of GroEL-(KMgATP)14, which was prepared for the simulations as described in Materials and Methods; this was the highest-resolution structure of the complete GroEL complex that was available in the Protein Data Bank. This high-resolution structure was then fit into density maps of GroEL both before (apo-GroEL) and after (GroEL-ATP) the ATP-induced conformational transition (38). Some of the results of this fitting are depicted in Figs. 7 and 8 and are described in detail below. The “intact domain” and “secondary” curves on these figures refer to two different fitting schemes using the GroEL-ATP map, and the “apo-GroEL” curve refers to the fitting results from the uncomplexed GroEL map.
Figure 7.

RMSD between initial and final structures for each GroEL fitting trajectory, averaged over the 14 subunits in the complex. The lower plot shows the same data as the upper plot, except that the curve was smoothed by averaging the RMSD values for 50 adjacent residues at each point. For each simulation, the region of largest mobility is the apical domain, with smaller motions in the intermediate domain. Divisions between the domains are denoted with vertical lines.
Figure 8.

Average deviation between the different subunits within a given fitted structure. The data in the lower plot is smoothed as in Fig. 7. The largest variance is in the apical and intermediate domains (Fig. 7), consistent with the observation that the regions that experience the largest motion also show the largest variance in their final positions. Vertical lines show the division between the equatorial, intermediate, and apical domains.
To assess the usefulness of our flexible fitting method, it is necessary to compare our results with what can be obtained through conventional rigid-body fitting. The apo-GroEL map was very similar to the GroEL crystal structure, and we were able to rigidly align the crystal structure with the map without modification. The crystal structure and the map were aligned by hand, and then the fit was optimized by maximizing the correlation function with only translational and rotational degrees of freedom. The best fit between the crystal structure and the apo-GroEL map gave a correlation coefficient of C = 0.8943.
We then carried out flexible fitting on the apo-GroEL map. The conformational change seen was very slight and involved an improvement of the correlation coefficient to C = 0.9013. Because the map was so similar to the initial conformation given by the crystal structure, we maintained the network of noncovalent interactions that were present in the initial structure. This noncovalent bond network maintained each individual α-helix as a separate rigid unit, and these rigid units were connected extensively to one another by flexible coil regions and sidechains, which served to maintain the overall shape of the complex. Fig. 7 shows a plot of the RMSD between residues in the crystal structure and the fitted GroEL structures, averaged over the 14 subunits in the complex. The apo-GroEL fitting showed most of its motion in the apical domain, somewhat less in the intermediate domain, and rather little motion in the equatorial domain.
To understand the intersubunit variations within the fitted structure of the multimeric GroEL complex, we measured the structural variation within the ensemble of 14 monomer structures at each residue (Fig. 8). For each residue, the RMSD was calculated and averaged over all unique intersubunit pairs. Carrying out this analysis for the crystal structure gives us a baseline of variation among nominally identical subunits, around 0.5 Å. For the fitted structures, the plot is extremely rough, and we can gain more insight by smoothing it out so that each point represents the average value for 50 adjacent residues. The most striking feature of the smoothed curve for apo-GroEL is its similarity to Fig. 7. The residues that experience the most motion during the fitting process are also those that show the greatest variation when fitting is complete.
The density map of GroEL complexed with ATP showed a significant conformational change from the apo-GroEL form. In their work describing this structural change, Ranson et al. (38) obtained an approximate fit to the density map by breaking the individual GroEL monomers into distinct domains, then fitting each of these domains separately into the map. This allowed us to estimate that GroEL makes a highly concerted conformational change with an RMSD of ∼6.3 Å. This change involves an axial extension of ∼14% (from ∼150 to 161 Å), a 4% increase in the radius of gyration (from 63.9 to 66.4 Å), and a counterclockwise outward rotation of the apical domains of each subunit. The best fit we could obtain between their domain-fitted structure and the cryo-EM map gave a correlation coefficient of C = 0.9507.
The same flexible fitting procedure used with the apo-GroEL map was then carried out on the GroEL-ATP map. The 2.0 Å crystal structure was again used as a starting conformation, but the larger conformational change involved made the choice of noncovalent bond network less clear than in the apo-GroEL case. We carried out the fitting with two different sets of noncovalent interactions. In the first, which we will refer to as the intact domain case, we calculated the noncovalent interactions for both the initial crystal structure and the structure obtained by rigid-domain fitting, and kept the interactions that were present in both cases. Any interactions that would be disrupted during the structural transition were therefore omitted, and those that are present at both endpoints were assumed to be present throughout the transition. In the second case, we maintained only those hydrogen bonds internal to secondary structure elements (i.e., α-helices and β-sheets) as identified in the crystal structure using STRIDE (39). The noncovalent interactions included in the secondary structure case were a subset of those included in the intact domain case, and generally allowed for more movement of the complex due to the smaller number of constraints. In the intact domain case, we were able to improve the correlation coefficient from an initial value of C = 0.9253 to a final value of C = 0.9571. In the secondary structure case, the correlation reached a final value of C = 0.9687, indicating that the increased mobility allowed us to find a better fit to the density map. Both flexibly-fit results obtained a better correlation than the rigid-body result of C = 0.9507.
The motion experienced by each residue during the fitting process is shown in Fig. 7. The motion in the secondary structure case shows several peaks that are not present in the intact domain case, especially in the equatorial domain. Many of these arise from the fact that the hydrogen bonds included were often not sufficient to maintain strict rigidity of secondary structure elements. For example, the last turn of an α-helix often was not part of the same rigid cluster as the rest of the helix and unwound in several cases, leading to a large RMSD for a few adjacent residues. The smoothed version of these curves show that both GroEL-ATP fitting simulations experienced significant motion in the apical domains, a second prominent peak in the N-terminal portion of the intermediate domain, and significantly less motion in the equatorial domains.
Analysis of the intersubunit variation for the results of the GroEL-ATP fitting simulations (Fig. 8) shows that, for both fitted structures, the largest variability is present in the apical and intermediate domains. The situation is similar to that seen with apo-GroEL; the residues that experience the most motion during fitting show the largest variability in the results. This variability is not a result of asymmetry in the cryo-EM map, which was refined with explicit sevenfold symmetry. Instead, these deviations from symmetry give a sense of the ambiguity inherent in fitting an atomic model to low-resolution data and allow us to estimate the precision of the resulting fit. In principle, it would be possible to force FRODA to make moves that are consistent with this sevenfold symmetry, thus producing a perfectly symmetric result. This was beyond the scope of this study.
Careful examination of the fitted structures produced by FRODA shows that a large number of intra- and intersubunit contacts were broken and re-formed during the course of the fitting simulations. In general, more contacts were broken than were re-formed; this stems in part from the more extended structure of the ATP-complexed GroEL and in part from the fact the FIRST does not optimize the formation of new interresidue contacts. New contacts were generally formed between the same regions of the protein subunits in which contacts were lost, indicating that the structural transition in GroEL involves deformations of the individual subunits more than the formation of entirely new contacts.
One can also compare the disruption and formation of protein–protein contacts in the flexibly fit structures with the contact changes in the structure obtained by rigid fitting. Relatively few intraresidue contacts are broken or re-formed in the rigid-fitting case relative to the flexible fitting. This is to be expected because the individual domains were treated as rigid units in the rigid fitting, but internal motions were allowed in the flexible fitting. The more intriguing result was that the changes in intersubunit contacts are almost identical for the two fitting methods. This suggests that, due to length scale limitations imposed by the map resolution, the constrained geometric fitting did a better job of capturing the relations between subunits than the internal dynamics of individual subunits.
Conclusion
We have described a method for the flexible fitting of x-ray structures to cryo-EM maps. Our results with theoretically-generated maps indicate that the method is viable over a broad range of resolutions and is robust in the face of noise. We have tested this method on experimental data by fitting the 2.0 Å structure of the GroEL complex to cryo-EM maps for both unliganded apo-GroEL and the ATP-bound state of GroEL.
The fitting of ATP-bound GroEL with two different sets of noncovalent constraints illustrates the need for balance between an optimal fitting score and stereochemical fidelity. The simulation in which only the hydrogen bonds within secondary structure elements were included gave a significantly better correlation coefficient than the simulation in which more noncovalent interactions were maintained. The secondary structure case, however, also showed some distortion of structural features and much larger deviations from the expected sevenfold symmetry, indicating a higher degree of error.
Acknowledgments
This work made extensive use of the High-Performance Computing Initiative at the Arizona State University Fulton School of Engineering and Applied Sciences. We acknowledge support from the National Institutes of Health (R01 GM 67249-01) and from the National Science Foundation (DMR-0304391, DMR-0078361).
Footnotes
Editor: Ron Elber.
Supplementary material
To view all of the supplemental files associated with this article, visit www.biophysj.org.
Appendix A.
Data Supplement 1
Data Supplement 2
Data Supplement 3
Movie S1

Movie S1

Movie S1

References
- 1.Baker T.S., Johnson J.E. Low resolution meets high: towards a resolution continuum from cells to atoms. Curr. Opin. Struct. Biol. 1996;6:585–594. doi: 10.1016/s0959-440x(96)80023-6. [DOI] [PubMed] [Google Scholar]
- 2.Rossmann M.G. Fitting atomic models into electron-microscopy maps. Acta Crystallogr. D Biol. Crystallogr. 2000;56:1341–1349. doi: 10.1107/s0907444900009562. [DOI] [PubMed] [Google Scholar]
- 3.Fabiola F., Chapman M.S. Fitting of high-resolution structures into electron microscopy reconstruction images. Structure. 2005;13:389–400. doi: 10.1016/j.str.2005.01.007. [DOI] [PubMed] [Google Scholar]
- 4.Wriggers W., Birmanns S. Using situs for flexible and rigid-body fitting of multiresolution single-molecule data. J. Struct. Biol. 2001;133:193–202. doi: 10.1006/jsbi.2000.4350. [DOI] [PubMed] [Google Scholar]
- 5.Chen J.Z., Furst J., Chapman M.S., Grigorieff N. Low-resolution structure refinement in electron microscopy. J. Struct. Biol. 2003;144:144–151. doi: 10.1016/j.jsb.2003.09.008. [DOI] [PubMed] [Google Scholar]
- 6.Gao H., Sengupta J., Valle M., Korostelev A., Eswar N., Stagg S.M., Van Roey P., Agrawal R.K., Harvey S.C., Sali A., Chapman M.S., Frank J. Study of the structural dynamics of the E. coli 70S ribosome using real-space refinement. Cell. 2003;113:789–801. doi: 10.1016/s0092-8674(03)00427-6. [DOI] [PubMed] [Google Scholar]
- 7.Tama F., Miyashita O., Brooks C.L., 3rd. Flexible multi-scale fitting of atomic structures into low-resolution electron density maps with elastic network normal mode analysis. J. Mol. Biol. 2004;337:985–999. doi: 10.1016/j.jmb.2004.01.048. [DOI] [PubMed] [Google Scholar]
- 8.Tama F., Miyashita O., Brooks C.L., 3rd. Normal mode based flexible fitting of high-resolution structure into low-resolution experimental data from cryo-EM. J. Struct. Biol. 2004;147:315–326. doi: 10.1016/j.jsb.2004.03.002. [DOI] [PubMed] [Google Scholar]
- 9.Delarue M., Dumas P. On the use of low-frequency normal modes to enforce collective movements in refining macromolecular structural models. Proc. Natl. Acad. Sci. USA. 2004;101:6957–6962. doi: 10.1073/pnas.0400301101. [DOI] [PMC free article] [PubMed] [Google Scholar]
- 10.Hinsen K., Reuter N., Navaza J., Stokes D.L., Lacapere J.J. Normal mode-based fitting of atomic structure into electron density maps: application to sarcoplasmic reticulum Ca-ATPase. Biophys. J. 2005;88:818–827. doi: 10.1529/biophysj.104.050716. [DOI] [PMC free article] [PubMed] [Google Scholar]
- 11.Cowley J.M. 2nd ed. North-Holland Publishing; Amsterdam: 1981. Diffraction Physics. [Google Scholar]
- 12.Penczek P.A., Yang C., Frank J., Spahn C.M. Estimation of variance in single-particle reconstruction using the bootstrap technique. J. Struct. Biol. 2006;154:168–183. doi: 10.1016/j.jsb.2006.01.003. [DOI] [PubMed] [Google Scholar]
- 13.Grigorieff N., Ceska T.A., Downing K.H., Baldwin J.M., Henderson R. Electron-crystallographic refinement of the structure of bacteriorhodopsin. J. Mol. Biol. 1996;259:393–421. doi: 10.1006/jmbi.1996.0328. [DOI] [PubMed] [Google Scholar]
- 14.Xing L., Tjarnlund K., Lindqvist B., Kaplan G.G., Feigelstock D., Cheng R.H., Casasnovas J.M. Distinct cellular receptor interactions in poliovirus and rhinoviruses. EMBO J. 2000;19:1207–1216. doi: 10.1093/emboj/19.6.1207. [DOI] [PMC free article] [PubMed] [Google Scholar]
- 15.Reference deleted in proof.
- 16.Reference deleted in proof.
- 17.Khayat R., Tang L., Larson E.T., Lawrence C.M., Young M., Johnson J.E. Structure of an archaeal virus capsid protein reveals a common ancestry to eukaryotic and bacterial viruses. Proc. Natl. Acad. Sci. USA. 2005;102:18944–18949. doi: 10.1073/pnas.0506383102. [DOI] [PMC free article] [PubMed] [Google Scholar]
- 18.Stagg S.M., Lander G.C., Pulokas J., Fellmann D., Cheng A., Quispe J.D., Mallick S.P., Avila R.M., Carragher B., Potter C.S. Automated cryo-EM data acquisition and analysis of 284742 particles of GroEL. J. Struct. Biol. 2006;155:470–481. doi: 10.1016/j.jsb.2006.04.005. [DOI] [PubMed] [Google Scholar]
- 19.Xiao C., Rossmann M.G. Interpretation of electron density with stereographic roadmap projections. J. Struct. Biol. 2007;158:182–187. doi: 10.1016/j.jsb.2006.10.013. [DOI] [PMC free article] [PubMed] [Google Scholar]
- 20.Wells S., Menor S., Hespenheide B., Thorpe M.F. Constrained geometric simulation of diffusive motion in proteins. Phys. Biol. 2005;2:S127–S136. doi: 10.1088/1478-3975/2/4/S07. [DOI] [PubMed] [Google Scholar]
- 21.Tama F., Gadea F.X., Marques O., Sanejouand Y.H. Building-block approach for determining low-frequency normal modes of macromolecules. Proteins. 2000;41:1–7. doi: 10.1002/1097-0134(20001001)41:1<1::aid-prot10>3.0.co;2-p. [DOI] [PubMed] [Google Scholar]
- 22.Gohlke H., Thorpe M.F. A natural coarse graining for simulating large biomolecular motion. Biophys. J. 2006;91:2115–2120. doi: 10.1529/biophysj.106.083568. [DOI] [PMC free article] [PubMed] [Google Scholar]
- 23.Jacobs D.J., Thorpe M.F. Generic rigidity percolation: the pebble game. Phys. Rev. Lett. 1995;75:4051–4054. doi: 10.1103/PhysRevLett.75.4051. [DOI] [PubMed] [Google Scholar]
- 24.Jacobs D.J., Thorpe M.F. Generic rigidity percolation in two dimensions. Phys. Rev. E Stat. Phys. Plasmas Fluids Relat. Interdiscip. Topics. 1996;53:3682–3693. doi: 10.1103/physreve.53.3682. [DOI] [PubMed] [Google Scholar]
- 25.Jacobs D.J., Rader A.J., Kuhn L.A., Thorpe M.F. Protein flexibility predictions using graph theory. Proteins. 2001;44:150–165. doi: 10.1002/prot.1081. [DOI] [PubMed] [Google Scholar]
- 26.Rader A.J., Hespenheide B.M., Kuhn L.A., Thorpe M.F. Protein unfolding: rigidity lost. Proc. Natl. Acad. Sci. USA. 2002;99:3540–3545. doi: 10.1073/pnas.062492699. [DOI] [PMC free article] [PubMed] [Google Scholar]
- 27.Hespenheide B.M., Rader A.J., Thorpe M.F., Kuhn L.A. Identifying protein folding cores from the evolution of flexible regions during unfolding. J. Mol. Graph. Model. 2002;21:195–207. doi: 10.1016/s1093-3263(02)00146-8. [DOI] [PubMed] [Google Scholar]
- 28.Hespenheide B.M., Jacobs D.J., Thorpe M.F. Structural rigidity in the capsid assembly of cowpea chlorotic mottle virus. J. Phys. Condens. Matter. 2004;16:S5055–S5064. [Google Scholar]
- 29.Metropolis The Monte Carlo method. J Am Stat Assoc. 1949;44:335. doi: 10.1080/01621459.1949.10483310. [DOI] [PubMed] [Google Scholar]
- 30.Rez D., Rez P., Grant I. Dirac-Fock calculations of x-ray scattering factors and contributions to the mean inner potential for electron scattering. Acta Crystallogr. A. 1994;50:481–497. [Google Scholar]
- 31.Wriggers W., Milligan R.A., McCammon J.A. Situs: a package for docking crystal structures into low-resolution maps from electron microscopy. J. Struct. Biol. 1999;125:185–195. doi: 10.1006/jsbi.1998.4080. [DOI] [PubMed] [Google Scholar]
- 32.Word J.M., Lovell S.C., Richardson J.S., Richardson D.C. Asparagine and glutamine: using hydrogen atom contacts in the choice of side-chain amide orientation. J. Mol. Biol. 1999;285:1735–1747. doi: 10.1006/jmbi.1998.2401. [DOI] [PubMed] [Google Scholar]
- 33.Kale L., Skeel R., Bhandarkar M., Brunner R., Gursoy A., Krawetz N., Phillips J., Shinozaki A., Varadarajan K., Schulten K. NAMD2: greater scalability for parallel molecular dynamics. J. Comput. Phys. 1999;151:283–312. [Google Scholar]
- 34.Jolley C.C., Wells S.A., Hespenheide B.M., Thorpe M.F., Fromme P. Docking of photosystem I subunit C using a constrained geometric simulation. J. Am. Chem. Soc. 2006;128:8803–8812. doi: 10.1021/ja0587749. [DOI] [PubMed] [Google Scholar]
- 35.Braig K., Otwinowski Z., Hegde R., Boisvert D.C., Joachimiak A., Horwich A.L., Sigler P.B. The crystal structure of the bacterial chaperonin GroEL at 2.8 A. Nature. 1994;371:578–586. doi: 10.1038/371578a0. [DOI] [PubMed] [Google Scholar]
- 36.Lin Z., Rye H.S. GroEL-mediated protein folding: making the impossible, possible. Crit. Rev. Biochem. Mol. Biol. 2006;41:211–239. doi: 10.1080/10409230600760382. [DOI] [PMC free article] [PubMed] [Google Scholar]
- 37.Wang J., Boisvert D.C. Structural basis for GroEL-assisted protein folding from the crystal structure of (GroEL-KMgATP)14 at 2.0A resolution. J. Mol. Biol. 2003;327:843–855. doi: 10.1016/s0022-2836(03)00184-0. [DOI] [PubMed] [Google Scholar]
- 38.Ranson N.A., Farr G.W., Roseman A.M., Gowen B., Fenton W.A., Horwich A.L., Saibil H.R. ATP-bound states of GroEL captured by cryo-electron microscopy. Cell. 2001;107:869–879. doi: 10.1016/s0092-8674(01)00617-1. [DOI] [PubMed] [Google Scholar]
- 39.Frishman D., Argos P. Knowledge-based protein secondary structure assignment. Proteins. 1995;23:566–579. doi: 10.1002/prot.340230412. [DOI] [PubMed] [Google Scholar]
Associated Data
This section collects any data citations, data availability statements, or supplementary materials included in this article.
Supplementary Materials
Data Supplement 1
Data Supplement 2
Data Supplement 3
Movie S1
Movie S1
Movie S1