


Figure 3.
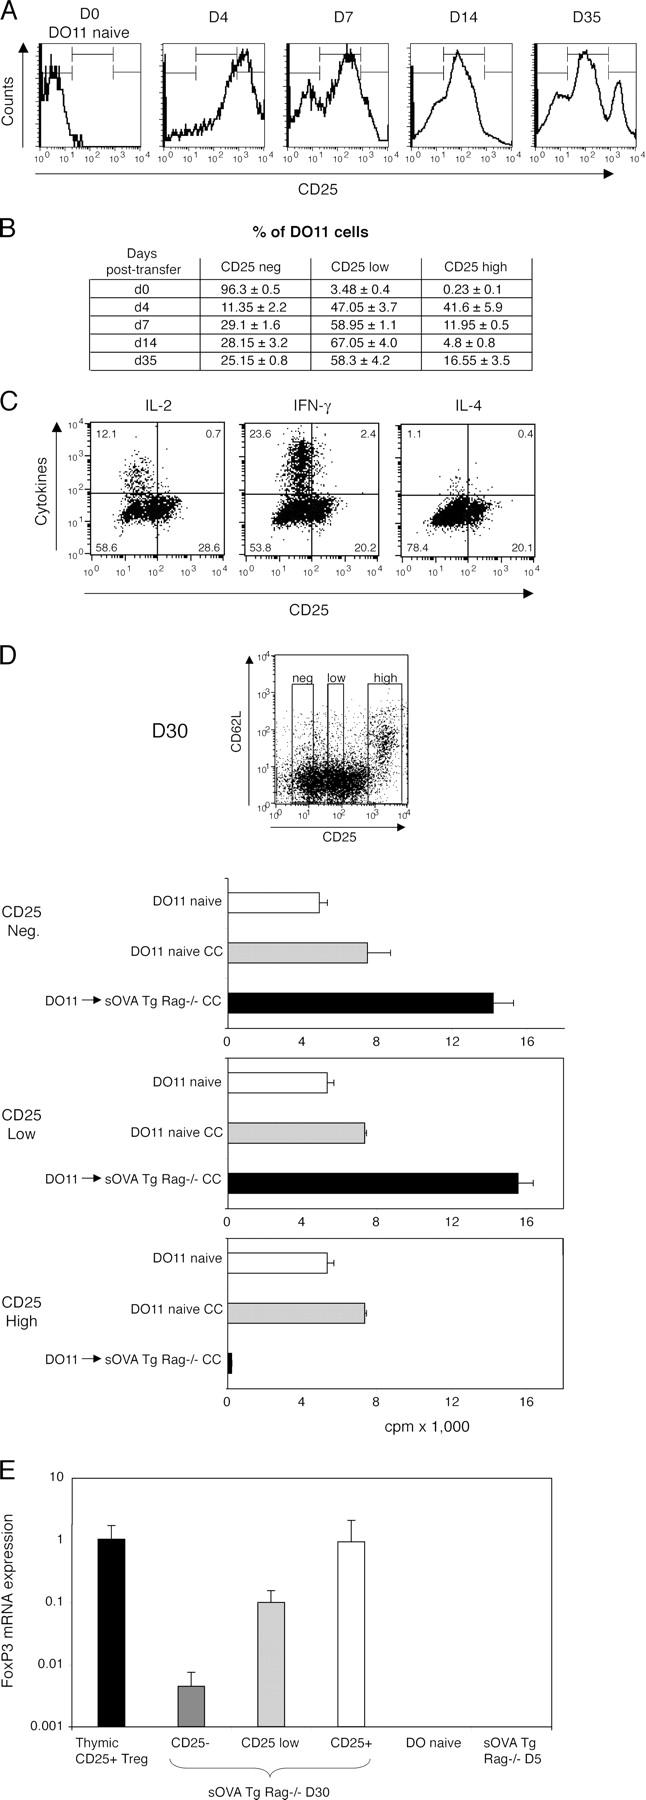
Peripheral development of effector cells and T reg cells. 106 CD4+-purified DO11 Rag−/− cells were transferred into sOVA Tg Rag−/− mice on day 0. (A) Peripheral lymph nodes were harvested at the indicated time points after transfer and analyzed for expression of KJ1-26+CD4+CD25+ cells by flow cytometry. Histograms show CD25 expression gated on KJ1-26+CD4+ cells from one representative mouse out of three experiments. (B) The table summarizes data pooled from two mice per group, based on gates shown in A. (C) Lymph node cells were harvested 30 d after transfer, restimulated with OVA peptide and APCs, and stained for intracellular cytokines. CD25 staining was done before permeabilization. All plots are gated on KJ1-26+CD4+ cells. Representative plots are shown from one experiment out of four with two mice per group. (D) Peripheral lymph node cells were harvested on day 30 after transfer and sorted for KJ1-26+CD4+ and negative (Neg.), intermediate (Low), or high (High) levels of CD25 expression as indicated in the FACS plot. The cells were co-cultured (CC) with sorted naive KJ1-26+CD4+CD25− cells from DO11 Rag−/− mice, and [3H]thymidine incorporation was assayed on day 3. (E) Lymph node and spleen cells from sOVA Tg Rag−/− mice at day 30 after transfer were sorted on KJ1-26+CD4+CD25 negative (−), low, and high (+) expression and analyzed for FoxP3 mRNA by real-time fluorogenic RT-PCR. Thymic- generated KJ1-26+CD4+CD25+ cells from DO11 × RIP-mOVA mice were included as a positive control; naive DO11 Rag−/− and KJ1-26+CD4+ cells recovered from sOVA Tg Rag−/− mice on day 5 were included as negative controls. Data are pooled from two experiments. Values in D and E represent means ± SD.