


Figure 1.
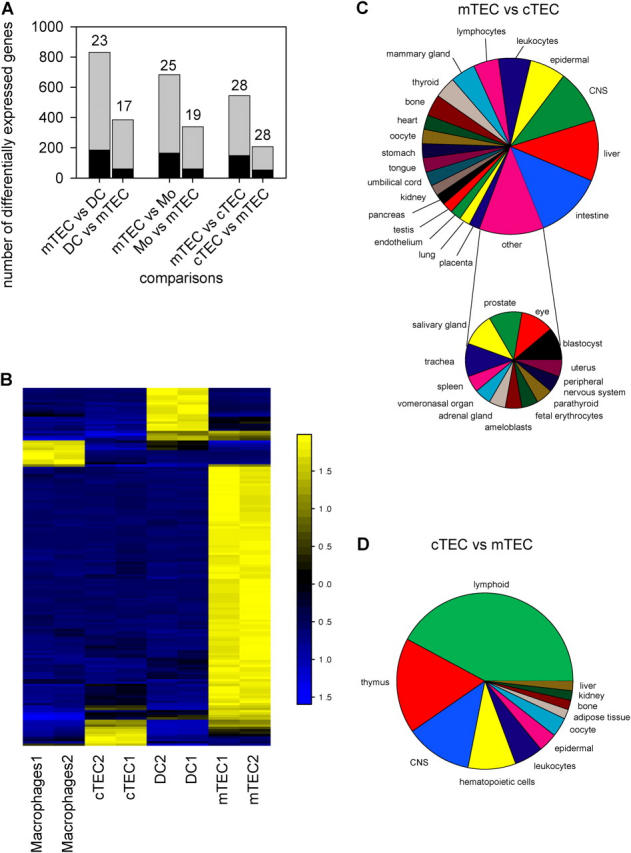
Global analysis of promiscuous gene expression in distinct thymic stromal cells. (A) Quantitative analysis of differentially expressed genes in mutual comparisons between mTECs and cTECs, DCs, and macrophages based on Affymetrix microarray analysis. The black bars indicate the fraction of TRAs contained in all genes overexpressed in the respective subsets and the relative percentages of TRAs are indicated above the bars. (B) ANOVA of all four stromal cell subsets showing the top 150 probe sets with adjusted p-values of <0.01. Note that mTECs display the highest proportion (106 out of 150) of differentially expressed genes. Yellow, up-regulated genes; blue, down-regulated genes; black, approximately the same gene expression as the mean for that gene across all samples. Numbers beside the color key represent mean ± SD of the respective gene. (C) Diverse tissue representation by genes overexpressed in mTECs vs. cTECs. (D) The reverse gene set shows limited tissue representation. Genes were assigned to tissues according to their predominant expression (Materials and methods). Mo, macrophages.