


Figure 9.

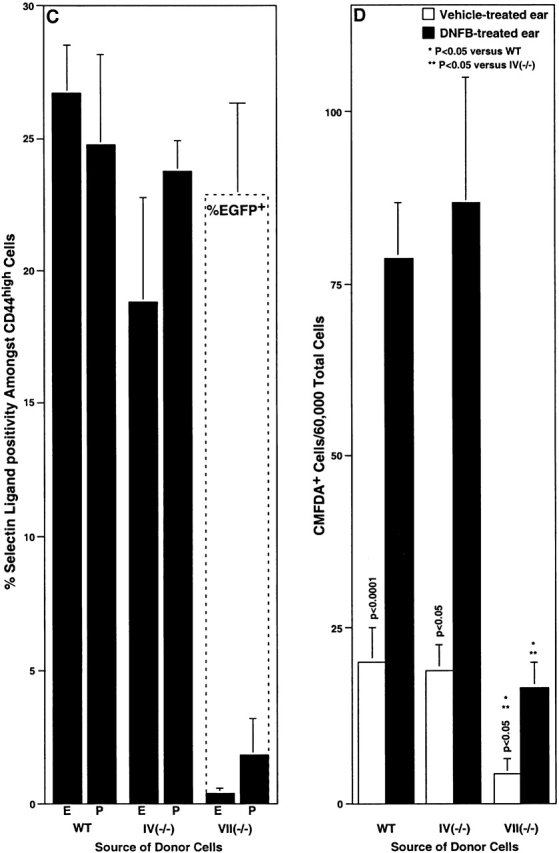
Recruitment of activated T cells into inflamed skin in WT and Fuc-T–deficient mice. Lymphocytes were isolated from the PLNs of mice previously sensitized with DNFB, and were used in flow cytometry analyses (A–C), or were labeled with CMFDA and used in adoptive transfer experiments (D) (Materials and Methods). (A) The fraction of activated (CD44high) lymphocytes (mean ± SE) determined by flow cytometry. (B) Expression of P-selectin ligands or the Fuc-TVII locus (reported by EGFP) by flow cytometry in WT, Fuc-TVII−/−, and Fuc-TVII(-EGFP/-EGFP) mice. The top pair of representative two parameter flow cytometry histograms show CD44 expression level versus P-selectin-IgM chimera binding in lymphocytes prepared from DNFB-sensitized WT or Fuc-TVII−/− mice. The bottom pair of representative two parameter flow cytometry histograms show CD44 expression level versus green fluorescence in lymphocytes prepared from DNFB-sensitized WT or Fuc-TVII(-EGFP/-EGFP) mice. Numbers in the top right and top left quadrants are the percentage of all viable cells in the node that fall within that quadrant. Schematic depictions of the WT Fuc-TVII locus (reference 6), the null Fuc-TVII locus (reference 6), and the Fuc-TVII null/EGFP knock-in locus (Materials and Methods) in Fuc-TVII(-EGFP/-EGFP) mice are at the bottom. DNA and protein sequences in the region encompassing the initiation codon of the Fuc-TVII-EGFP fusion protein are above the Fuc-TVII null/EGFP knock-in schematic. (C) The fraction of CD44high cells in WT, Fuc-TIV−/−, or Fuc-TVII−/− cells that are positive for E-selectin-IgM or P-selectin-IgM chimera binding (mean ± SE) determined by flow cytometry (black bars), or the fraction of Fuc-TVII(-EGFP/-EGFP) cells (see B) that are green fluorescent (dashed box overlying the Fuc-TVII−/− bars; mean ± SE). (D) Adoptive transfer. 20 × 106 CMFDA-labeled cells were administered by tail vein injection to DNFB sensitized WT recipients. Recipients were immediately challenged with DNFB on one ear, and were treated with vehicle on the other ear. 24 h later, the number of CMFDA-positive donor cells in the dermis and epidermis combined, for each ear, was enumerated by flow cytometry (mean ± SE). Differences in CMFDA+ cell accumulation between genotypes were analyzed as in Fig. 1.