


Fig. 2.
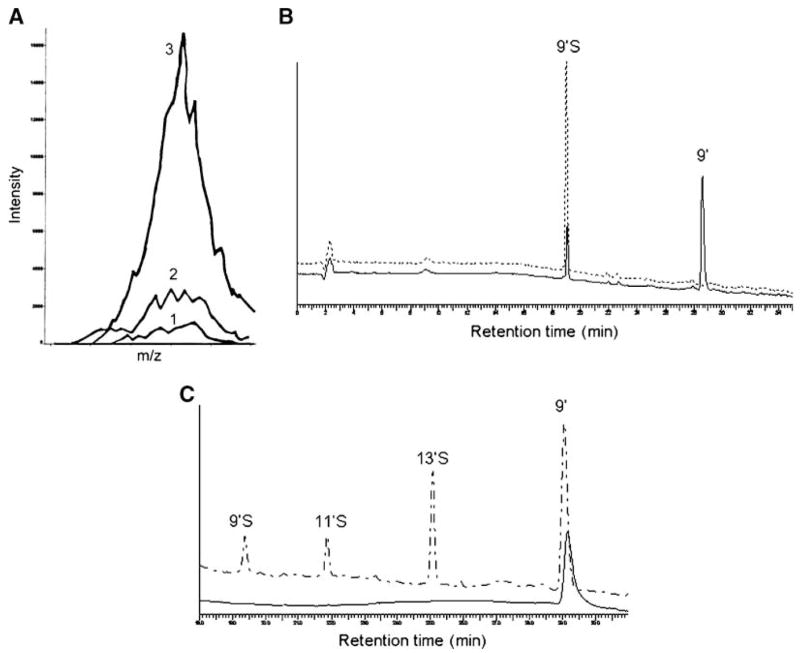
A: Inductively coupled plasma mass spectrometry (ICP-MS) detection of 34S for isolated 9′S. Traces 1, 2, and 3 show 34S intensity of 2% HNO3 (the solvent blank), an isolated mobile phase control, and isolated 9′S, respectively. B: HPLC of the isolated 9′S, which was incubated in 0.1 M sodium acetate (pH 5) at 37°C for 1 h (upper trace), and after 9′S was digested with a sulfatase under the same conditions (lower trace). C: Relative responses of metabolites to electrochemical oxidation (lower trace) compared with fluorescent signal detection (upper trace). Metabolites from γ-T extracted from cell culture media were separated by HPLC and detected by fluorescence detection (excitation and emission wavelengths were set at 292 and 327 nm, respectively), followed by coulometric detection at 400 mV using a model 5011 analytical cell.