


Figure 3.
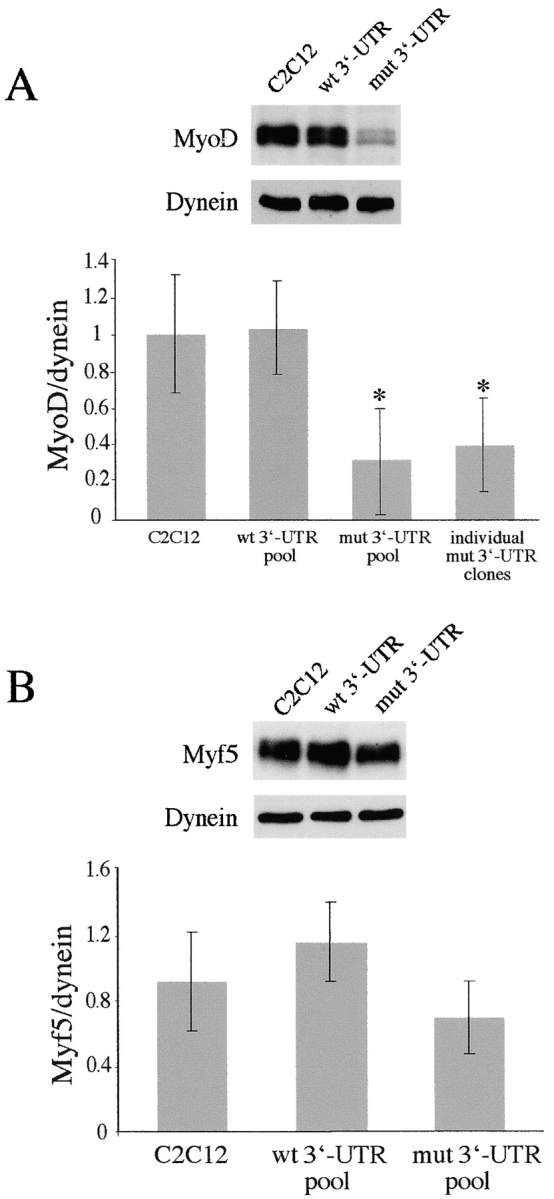
Protein levels of MyoD, but not Myf5, are low in proliferating GFP+mut 3′-UTR cells. (A) Despite variability, Western blots indicate that MyoD levels are significantly lower in proliferating GFP+mut 3′-UTR pool (mut 3′-UTR) cells as compared with GFP+wt 3′-UTR (wt 3′-UTR) and control C2C12 cells. Western blot results from six independent experiments were quantified by densitometry. The graph shows the average MyoD levels (normalized to dynein). Also shown is the average MyoD level among six individual GFP+mut 3′-UTR clones, which is similar to the average in the GFP+mut 3′-UTR pool. An asterisk (*) signifies a statistical difference (P < 0.05) when compared with both C2C12 and GFP+wt 3′-UTR pool cells. (B) Myf5 levels are also variable in proliferating cells, but quantification of Myf5 Western blots (n = 3 experiments) showed no significant differences among C2C12, GFP+wt 3′-UTR pool, and GFP+mut 3′-UTR pool cells. Error bars represent one standard deviation.