


Figure 3.
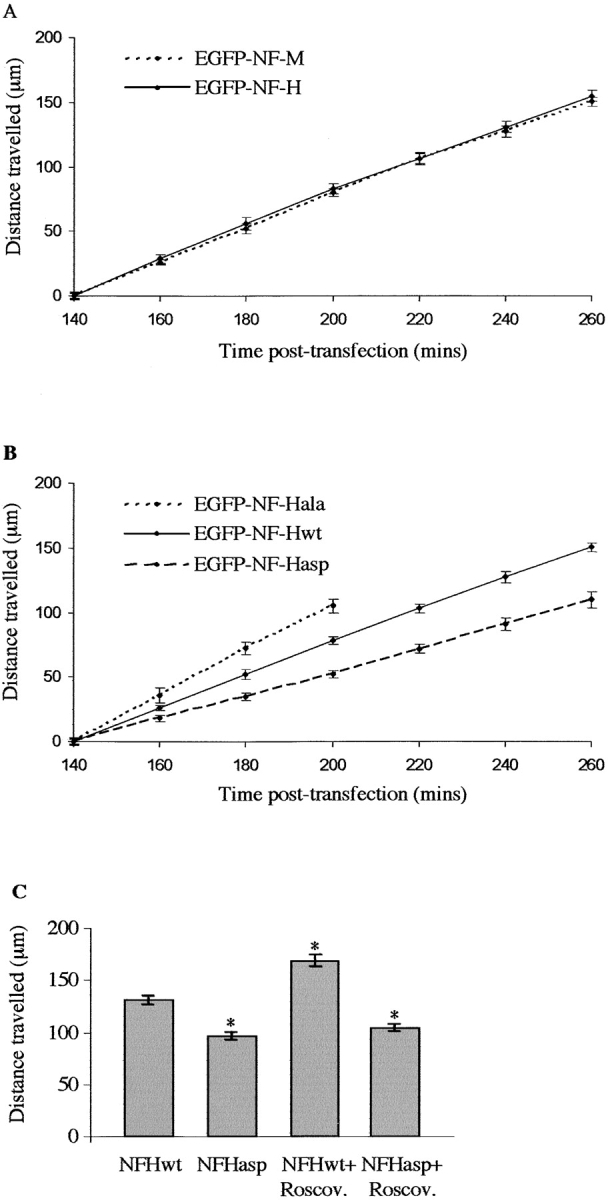
Analyses of GFP–NFH transport in transfected neurons. (A) Distances travelled by GFP–NFHwt and GFP–NFM at 140–260 min after transfection. One-way ANOVA tests showed no significant differences between GFP–NFHwt and GFP–NFM transport at any time point. (B) Distances travelled by GFP–NFHwt, GFP–NFHala, and GFP–NFHasp at 140–260 min after transfection. One-way ANOVA tests showed significant differences between GFP–NFHwt and GFP–NFHala (P = 0.045) and between GFP–NFHala and GFP–NFHasp (P = 0.001) at the 160-min time point. GFP–NFHwt and GFP–NFHasp displayed significant differences at the 180-min time point (P = 0.005). At later time points, significant differences between all three GFP–NFH proteins were observed (P < 0.001). (C) Histogram shows distance travelled by GFP–NFHwt and GFP–NFHasp 240 min after transfection in either 20 μM roscovitine (Roscov.) or vehicle-treated neurons. Roscovitine or vehicle was applied 130 min after transfection. An asterisk indicates treatments that display significant differences (P < 0.001) compared with vehicle-treated GFP–NFHwt, as analyzed by One-way ANOVA tests. No significant difference of GFP–NFHasp transport was observed between vehicle- and roscovitine-treated neurons. As detailed previously (Ackerley et al., 2000), the distances travelled by GFP–NFHwt/ala/asp at the first (140 min) time point are all adjusted to zero, so as to facilitate comparisons between experiments, and do not represent the actual distances travelled from cell bodies. Each data set shown for A–C is from one representative experiment, and error bars are the SEM.