


Figure 5.
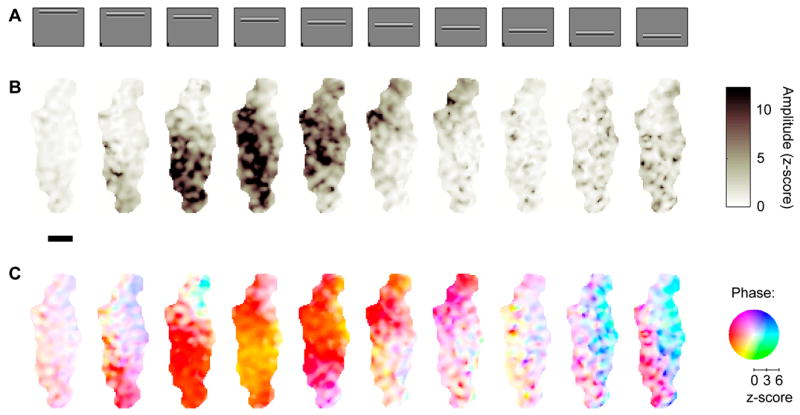
The oscillations in the 2nd harmonic responses have different phases depending on stimulus position. (A) Stimuli are the same as Figure 4. (B) Amplitude of 2nd harmonic responses (same data as in Figure 4D, only here it is shown in z-scores). (C) The phase of the 2nd harmonic responses depends on distance from the stimulated region of cortex. Phase is coded by color according to pinwheel shown in the right, with color saturation varying with response amplitude. As indicated by the scale below the pinwheel, the phases of responses with z-scores below about 2 are shown in white. Color-coded phase varies smoothly from yellow in regions that are retinotopically centered on the stimulus to red, purple, and then cyan in regions that are progressively more distant. Experiment 67-2-1.