


Fig. 4.
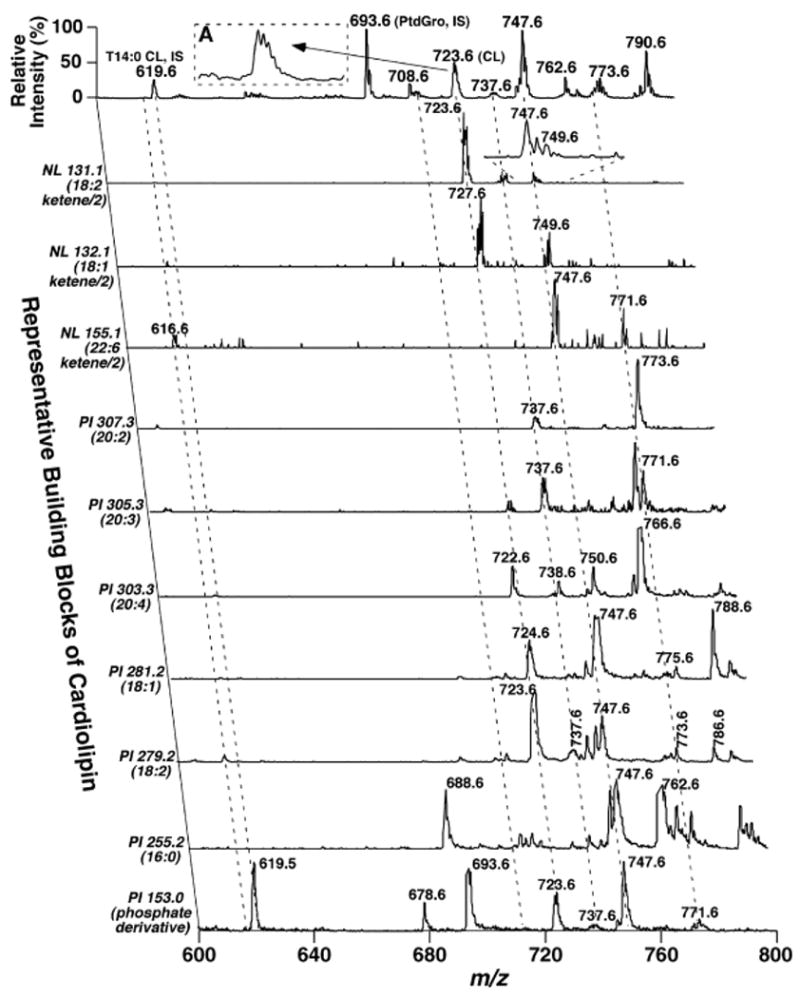
Two-dimensional mass spectrometric analysis of cardiolipin molecular species in lipid extracts of mouse myocardium. Each MS or tandem MS trace of two-dimensional ESI mass spectra was acquired by sequentially programmed custom scans with Xcalibur software on a QqQ mass spectrometer using a peak width setting of 0.7 Th, as described in Materials and Methods. For negative ion tandem mass spectrometry in the precursor ion (PI) mode, the first quadrupole was scanned in the selected mass range, the second quadruple was used as a collision cell, and the third quadrupole was fixed to monitor the building block ions of cardiolipin (i.e., either glycerophosphate or a fatty acyl carboxylate). For tandem mass spectrometry in the negative ion neutral loss (NL) mode, both the first and third quadrupoles were coordinately scanned with a mass difference (i.e., neutral loss) corresponding to the neutral loss of a ketene (representing a building block of cardiolipin molecular species) from doubly charged cardiolipin ions, whereas collisional activation was performed in the second quadrupole. Most of the mass spectral traces were displayed after normalization to the most intense peak (base peak) in each individual trace, although some of them were displayed after truncating the most abundant ion peak to show the low-abundance fragments. IS denotes internal standard; CL represents doubly charged cardiolipin. The broken lines indicate the analyses of some of the cardiolipin molecular species. PtdGro, phosphatidylglycerol.