


Figure 2.
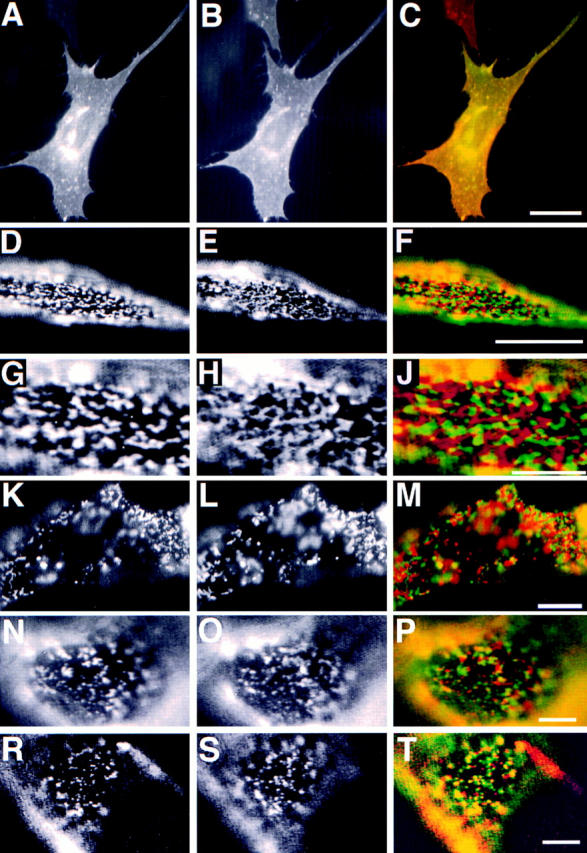
Patching of PLAP and transmembrane proteins hTfR, hTfR del 5–41, LDL-R YA18, and VSV-G. The left column shows PLAP distribution. The middle column shows distribution of hTfR (B, E, H, and L), LDL-R YA 18 mutant (O), and VSV-G (S). The right column shows the merge of the two signals. A–C shows immunofluorescence of PLAP (green) and hTfR (red) on fixed BHK cells. D–J shows segregation of patched PLAP (green) and hTfR (red). G–J shows a detail of D–F. K–M shows segregation patches of cross-linked PLAP (green) and hTfR del 5–41 (red) at 37°C. N–P shows patches of cross-linked PLAP (green) and LDL-R YA18 (red). R–T show patches of PLAP (red) and VSV-G (green). Bars: (C) 10 μm; (F) 5 μm; (J, M, P, and T) 3 μm.